Browserarena
Browserarena is an open-source benchmarking and comparison platform for cloud browser infrastructure providers. It objectively evaluates and ranks …
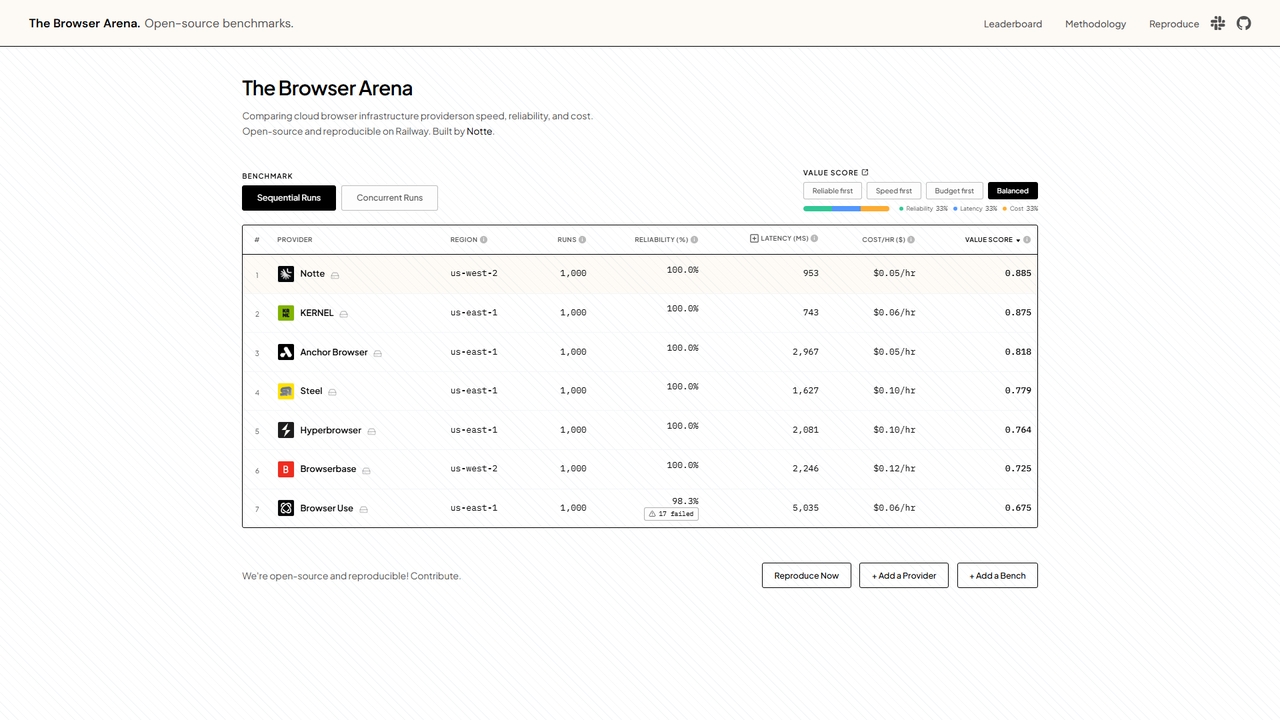
Browserarena is an open-source benchmarking and comparison platform for cloud browser infrastructure providers. It objectively evaluates and ranks providers based on key performance metrics including speed (latency), reliability (success rate), and cost per hour, helping developers and businesses make data-driven decisions for their browser automation and testing needs.
Geekbench
Geekbench is a leading cross-platform benchmarking tool that measures the performance of CPUs, GPUs, and AI/ML workloads. It …
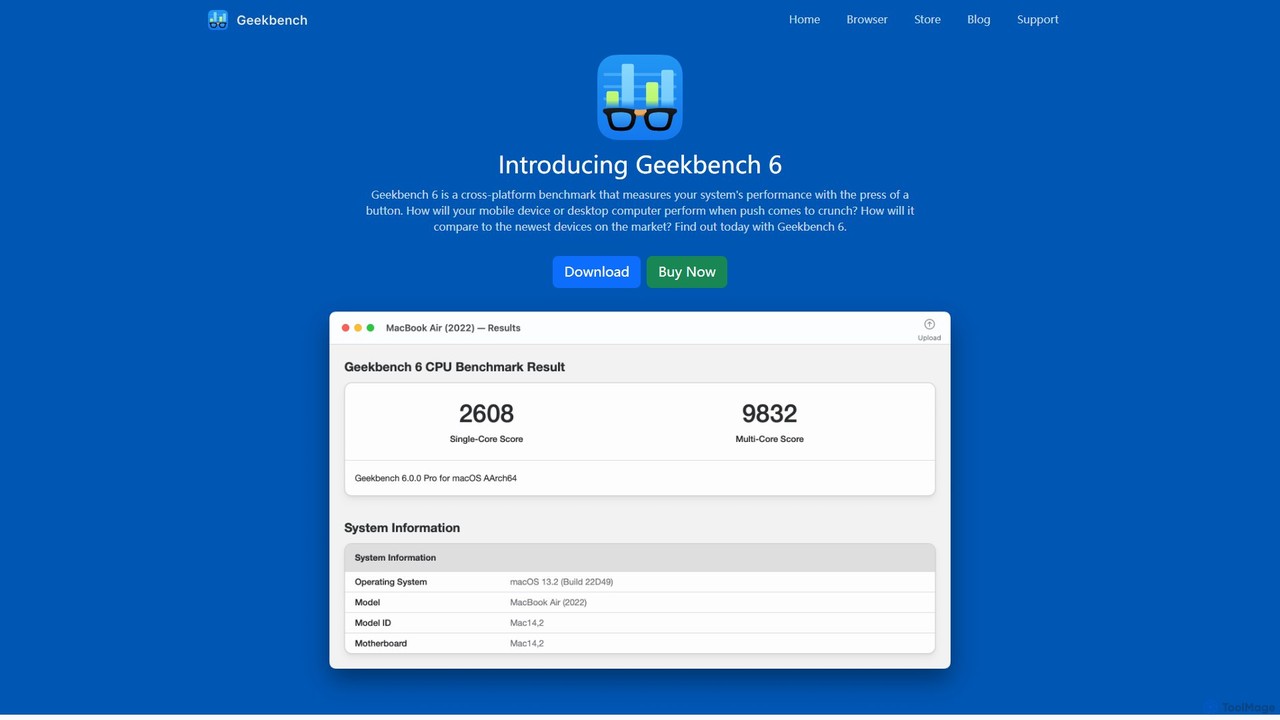
Geekbench is a leading cross-platform benchmarking tool that measures the performance of CPUs, GPUs, and AI/ML workloads. It uses real-world tests to provide accurate single-core and multi-core scores, allowing users to compare performance across a wide range of devices, operating systems (Windows, macOS, Linux, iOS, Android), and processor architectures.
Dynatrace
Dynatrace is an all-in-one, AI-powered observability and security platform. It provides intelligent automation and precise answers about the …
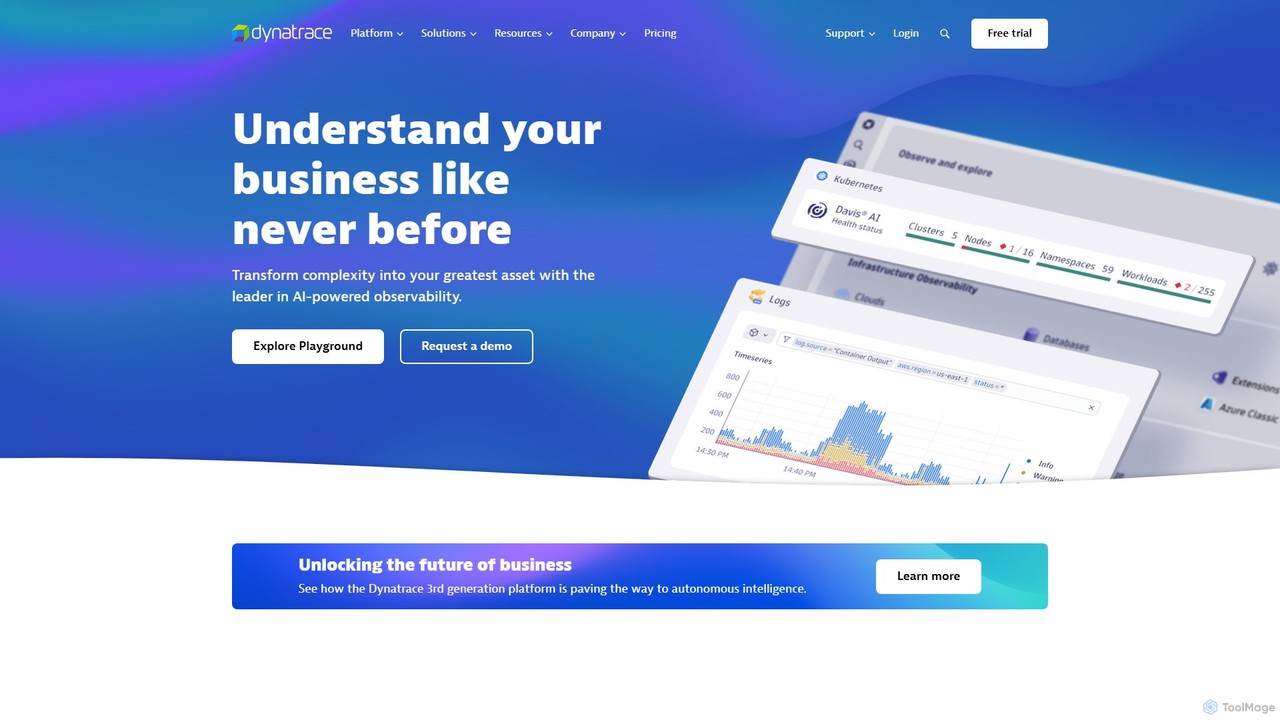
Dynatrace is an all-in-one, AI-powered observability and security platform. It provides intelligent automation and precise answers about the performance of applications, the underlying infrastructure, and the experience of all users, enabling organizations to innovate faster, collaborate more efficiently, and deliver better business outcomes.
About Performance Testing
Performance Testing tools are a specialized category of developer software used to measure, validate, and optimize the speed, stability, and scalability of applications. These tools work by simulating a high volume of virtual users or API calls to replicate real-world load conditions. This process helps identify performance bottlenecks, predict system behavior under stress, and ensure a smooth user experience before deployment. As a critical component of the software development lifecycle, they provide the data needed to prevent crashes, reduce latency, and efficiently manage infrastructure resources.
Core Features
- Load Generation: Simulates thousands or millions of concurrent virtual users from various geographic locations to test system capacity.
- Real-time Monitoring: Tracks key performance indicators (KPIs) like response time, throughput, error rate, and server resource utilization (CPU, memory).
- Scenario Scripting: Allows for the creation of complex user journeys and workflows to mimic realistic user behavior.
- Bottleneck Analysis: Helps pinpoint specific code, database queries, or infrastructure components that are causing performance degradation.
- Automated Reporting: Generates detailed reports with graphs and data visualizations to analyze test results and share findings with stakeholders.
Use Cases
Performance Testing tools are essential for DevOps engineers, QA testers, and Site Reliability Engineers (SREs) in industries like e-commerce, finance, SaaS, and gaming. They are used for pre-launch stress testing of a new website, validating the scalability of a microservices API, or integrating automated performance checks into a CI/CD pipeline to catch regressions early.
How to Choose
When selecting a Performance Testing tool, consider its protocol support (e.g., HTTP/S, WebSocket, gRPC), its ability to scale and distribute load, and its integration capabilities with monitoring and CI/CD systems. Also, evaluate the balance between ease of use (GUI-based tools) and flexibility (code-based tools) based on your team's technical skills, as well as the overall pricing model (open-source, pay-per-test, or subscription).

Performance TestingUse Cases
E-commerce Black Friday Readiness Testing
An e-commerce DevOps team prepares for the massive traffic surge of a Black Friday sale. Using a performance testing tool, they simulate hundreds of thousands of users simultaneously browsing products, adding items to carts, and checking out. The tool monitors server response times and database load in real-time. This allows the team to identify and fix bottlenecks in the payment gateway integration and optimize database queries, ensuring the site remains fast and available during the most critical sales period, preventing revenue loss due to crashes.
API Scalability Testing for a SaaS Platform
A backend developer for a SaaS company needs to ensure a new API endpoint can handle the expected load from thousands of client applications. They write a test script that simulates a realistic mix of GET and POST requests to the endpoint. The performance test tool ramps up the number of virtual users from 100 to 10,000 over 30 minutes. The results show that response times degrade significantly after 5,000 concurrent users. By analyzing the detailed report, the developer identifies an inefficient database index, fixes it, and reruns the test to confirm the API now meets its performance service-level agreement (SLA).
Continuous Performance Testing in a CI/CD Pipeline
A Site Reliability Engineer (SRE) integrates an automated performance test into their company's CI/CD pipeline. After every successful build, the pipeline automatically triggers a small-scale load test against the staging environment. The test runs for 10 minutes, simulating 500 users. The tool is configured to fail the build if the average response time exceeds 200ms or the error rate is above 1%. This proactive approach allows the team to catch performance regressions caused by new code changes immediately, long before they reach production, ensuring consistent application performance.
Identifying the Breaking Point with a Stress Test
A QA engineer needs to determine the maximum capacity of a new microservice before it fails. They design a stress test that gradually increases the number of virtual users every minute, starting from a low baseline. The performance testing tool monitors the error rate and server CPU utilization. The test reveals that at 8,000 concurrent users, the error rate spikes to 50% and the CPU hits 100% utilization. This data defines the system's breaking point, providing valuable information for capacity planning and setting up appropriate auto-scaling rules in the production environment.
Benchmarking Website Performance Against Competitors
A product manager wants to ensure their new landing page loads faster than their main competitor's. A performance engineer uses a testing tool to script a simple user journey: loading the homepage and clicking on the 'Pricing' page for both their site and the competitor's. The tool runs this test from multiple geographic locations (e.g., North America, Europe, Asia) to get a comprehensive view. The resulting report provides a side-by-side comparison of metrics like Time to First Byte (TTFB) and page load time, highlighting specific assets (large images, slow scripts) that can be optimized to gain a competitive edge.
Validating Infrastructure Changes with Soak Testing
After migrating a database to a new cloud provider, a DevOps team needs to verify its long-term stability. They set up a soak test, which runs a moderate, consistent load against the application for an extended period (e.g., 24-48 hours). The performance testing tool continuously logs memory usage, CPU load, and database connection counts. This test helps uncover subtle issues like memory leaks or resource exhaustion that would not appear in short-term load tests. By confirming that performance metrics remain stable over the entire duration, the team validates the success of the migration and ensures long-term reliability.