Mixpanel is a powerful product analytics platform that helps businesses understand user behavior, measure key metrics, and make data-driven decisions. It offers self-serve analytics, session replays, and data integrations to empower teams across product, marketing, and engineering to drive growth and retention.

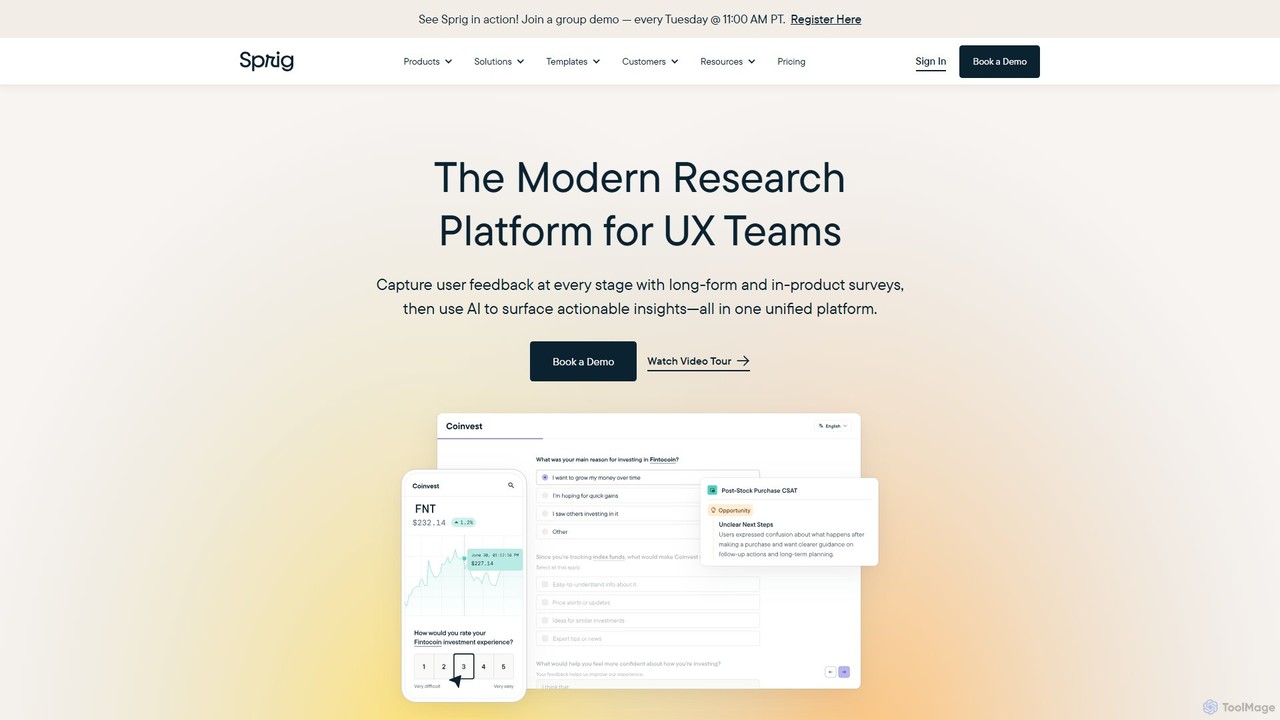
Sprig is a modern research platform for UX teams, using AI to capture user feedback through surveys, session replays, and heatmaps. It helps teams analyze user behavior, identify pain points, and make faster, data-backed product decisions.
Product overview
Mixpanel Product overview
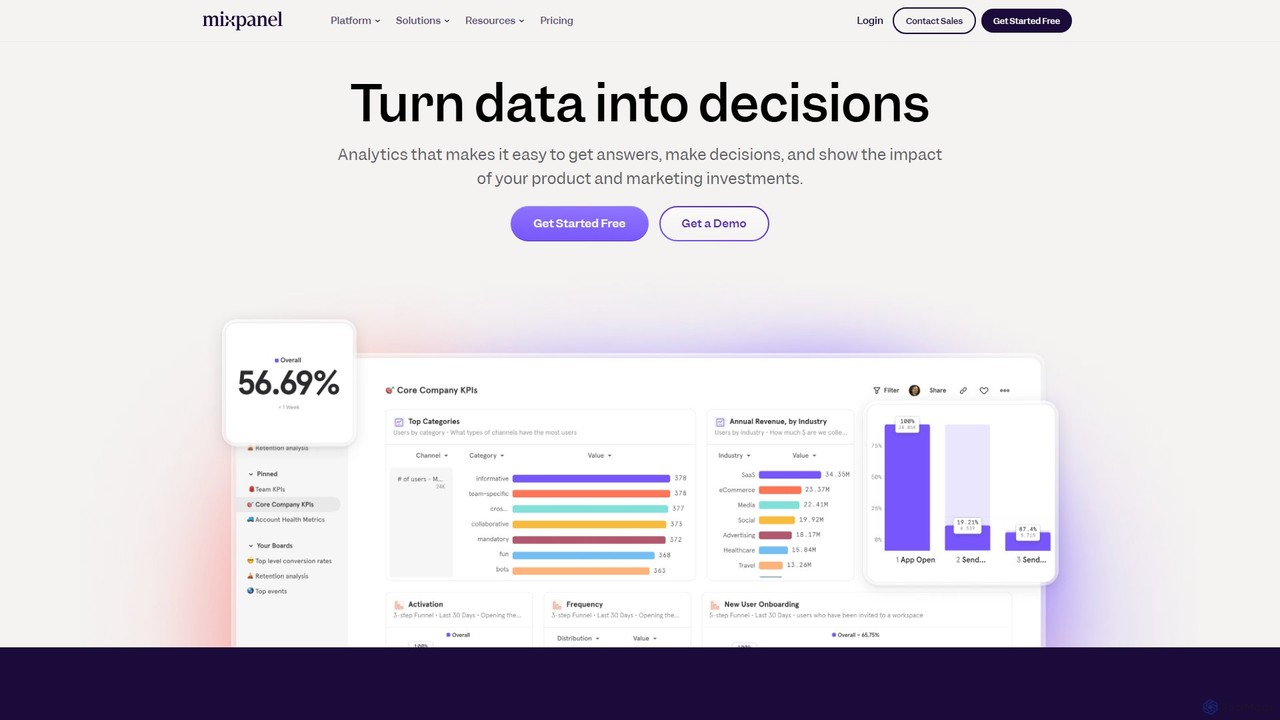
Mixpanel is a powerful product analytics platform that helps businesses understand user behavior, measure key metrics, and make data-driven decisions. It offers self-serve analytics, session replays, and data integrations to empower teams across product, marketing, and engineering to drive growth and retention.
Sprig Product overview
Sprig is a modern research platform for UX teams, using AI to capture user feedback through surveys, session replays, and heatmaps. It helps teams analyze user behavior, identify pain points, and make faster, data-backed product decisions.
Detailed feature comparison
| Feature | Mixpanel | Sprig |
|---|---|---|
| Primary category | Analytics | Analytics |
| Added | 2025-08-12 | 2025-08-02 |
| Pricing | Freemium | Freemium |
| Official website | mixpanel.com | sprig.com |
| Product type | Website | Website |
| Performance data | ||
| User rating | Not verified | Not verified |
| Comments | 0 | 0 |
| Monthly visits | 1.5M | 316K |
| Monthly growth | -2.8% | 13.6% |
| Favorites | 124 | 135 |
| Details | View details | View details |
Mixpanel vs Sprig monthly traffic
Compare Mixpanel and Sprig by monthly reach, traffic trend, visit depth, top regions, and acquisition sources.
How to interpret the traffic data
In the Mixpanel vs Sprig monthly traffic comparison, Mixpanel currently shows 1.5M visits and Sprig shows 316K; Mixpanel has about 4.8 times the visible traffic of Sprig, an absolute difference of about 1.2M visits. This reflects visible reach, not feature quality or paid users.
Both tools provide verified traffic details, so monthly trends, visit depth, regions, and acquisition sources can be compared on the same basis.
Mixpanel monthly traffic:
Latest traffic
Monthly traffic trend
- 2025/9: 1.6M Monthly visits
- 2026/1: 1.5M Monthly visits
- 2026/2: 1.4M Monthly visits
- 2026/3: 1.5M Monthly visits
- 2026/4: 1.6M Monthly visits
- 2026/5: 1.5M Monthly visits
Top regions
Top 5 countries/regions
| Country/region | Percentage | Traffic |
|---|---|---|
| 🇺🇸United States | 40.23% | 607.7K |
| 🇮🇳India | 37.49% | 566.4K |
| 🇬🇧United Kingdom | 10.19% | 153.9K |
| 🇵🇱Poland | 6.42% | 97K |
| 🇮🇱Israel | 5.67% | 85.7K |
Traffic sources
| Source type | Percentage | Traffic |
|---|---|---|
| Direct | 94.56% | 1.4M |
| 2.76% | 41.7K | |
| Referral | 2.68% | 40.5K |
Search keywords
Sprig monthly traffic:
Latest traffic
Monthly traffic trend
- 2025/9: 323.5K Monthly visits
- 2026/1: 341.2K Monthly visits
- 2026/2: 310.6K Monthly visits
- 2026/3: 265K Monthly visits
- 2026/4: 278.2K Monthly visits
- 2026/5: 316K Monthly visits
Top regions
Top 5 countries/regions
| Country/region | Percentage | Traffic |
|---|---|---|
| 🇺🇸United States | 91.19% | 288.2K |
| 🇨🇦Canada | 3.03% | 9.6K |
| 🇻🇳Vietnam | 3.03% | 9.6K |
| 🇬🇧United Kingdom | 1.44% | 4.6K |
| 🇩🇪Germany | 1.31% | 4.1K |
Traffic sources
| Source type | Percentage | Traffic |
|---|---|---|
| Referral | 58.55% | 185K |
| Direct | 34.19% | 108K |
| 7.26% | 22.9K |
Search keywords
Usage comparison
Compare the core capabilities of Mixpanel and Sprig
Mixpanel Core features
Sprig Core features
Use cases
Mixpanel Use cases
Sprig Use cases
Mixpanel vs Sprig:In-depth comparison and selection guidance
First decide whether the products solve the same kind of need
This in-depth Mixpanel vs Sprig comparison uses only the product records, taxonomy, audience, traffic, and community signals available on this page. Mixpanel is primarily listed under “Analytics”, while Sprig is primarily listed under “Analytics”, so the first decision is whether your actual task matches their recorded scope.
The structured fields currently show these decision-relevant differences: Monthly visits (Mixpanel: 1.5M; Sprig: 316K); Monthly growth (Mixpanel: -2.8%; Sprig: 13.6%); Favorites (Mixpanel: 124; Sprig: 135); Website (Mixpanel: mixpanel.com; Sprig: sprig.com); Added (Mixpanel: 2025-08-12; Sprig: 2025-08-02). These facts are more useful for selection than brand visibility alone.
What market visibility and monthly traffic mean
In the Mixpanel vs Sprig monthly traffic comparison, Mixpanel currently shows 1.5M visits and Sprig shows 316K; Mixpanel has about 4.8 times the visible traffic of Sprig, an absolute difference of about 1.2M visits. This reflects visible reach, not feature quality or paid users.
Both tools provide verified traffic details, so monthly trends, visit depth, regions, and acquisition sources can be compared on the same basis.
If public market visibility is an important first-pass criterion, investigate Mixpanel first. The final choice should still follow taxonomy, use case, and a real trial because higher traffic does not prove broader capabilities or better workflow fit.
Product positioning, use cases, and roles
Mixpanel and Sprig currently overlap in shared categories: Analytics; shared tags: data analysis and session replay. This can place both on the same shortlist, but it does not prove equal implementation, depth, or cost.
Mixpanel's unique categories/tags are Data Management, Customer Behavior, A/B testing, business intelligence, data warehouse, marketing analytics, product analytics, and user behavior; Sprig's are Customer Feedback, User Research, AI analysis, customer feedback, in-product surveys, product management, user experience, and user research. These unique fields are the strongest differentiators: validate the product whose recorded scope matches the task instead of following traffic alone.
What ratings, comments, and favorites can tell you
Mixpanel has no verified rating, 0 comments, 124 favorites, and 115 likes;Sprig has no verified rating, 0 comments, 135 favorites, and 111 likes。
Neither product has enough rating or comment samples for a credible reputation ranking.
Selection guidance by actual need
When to evaluate Mixpanel first
Put Mixpanel on the priority trial list when the task aligns with “Analytics” and especially Data Management, Customer Behavior, A/B testing, business intelligence, data warehouse, and marketing analytics. This follows recorded positioning and does not imply unlisted capabilities are absent.
Mixpanel also currently records: pricing is freemium, product type is website, 1.5M verified monthly visits, no verified user rating. Verify any hard requirement around price, platform, or reach before trial, and do not let sparse review data substitute for testing.
When to evaluate Sprig first
Put Sprig on the priority trial list when the task aligns with “Analytics” and especially Customer Feedback, User Research, AI analysis, customer feedback, in-product surveys, and product management. This follows recorded positioning and does not imply unlisted capabilities are absent.
Sprig also currently records: pricing is freemium, product type is website, 316K verified monthly visits, no verified user rating. Verify any hard requirement around price, platform, or reach before trial, and do not let sparse review data substitute for testing.
How to validate the recommendation before deciding
The available data describes positioning, public visibility, and community signals, but it cannot prove output quality, speed, integration effort, privacy, or long-term cost in your workflow. Before deciding, run the same representative tasks in Mixpanel and Sprig, then record completion time, accuracy, manual corrections, and the real paid threshold. A like-for-like trial turns this comparison into a defensible adoption decision.
Comparison FAQ
How should I choose between Mixpanel and Sprig?
Where does this comparison data come from?
What do unknown fields mean?
Related AI tools

Amplitude
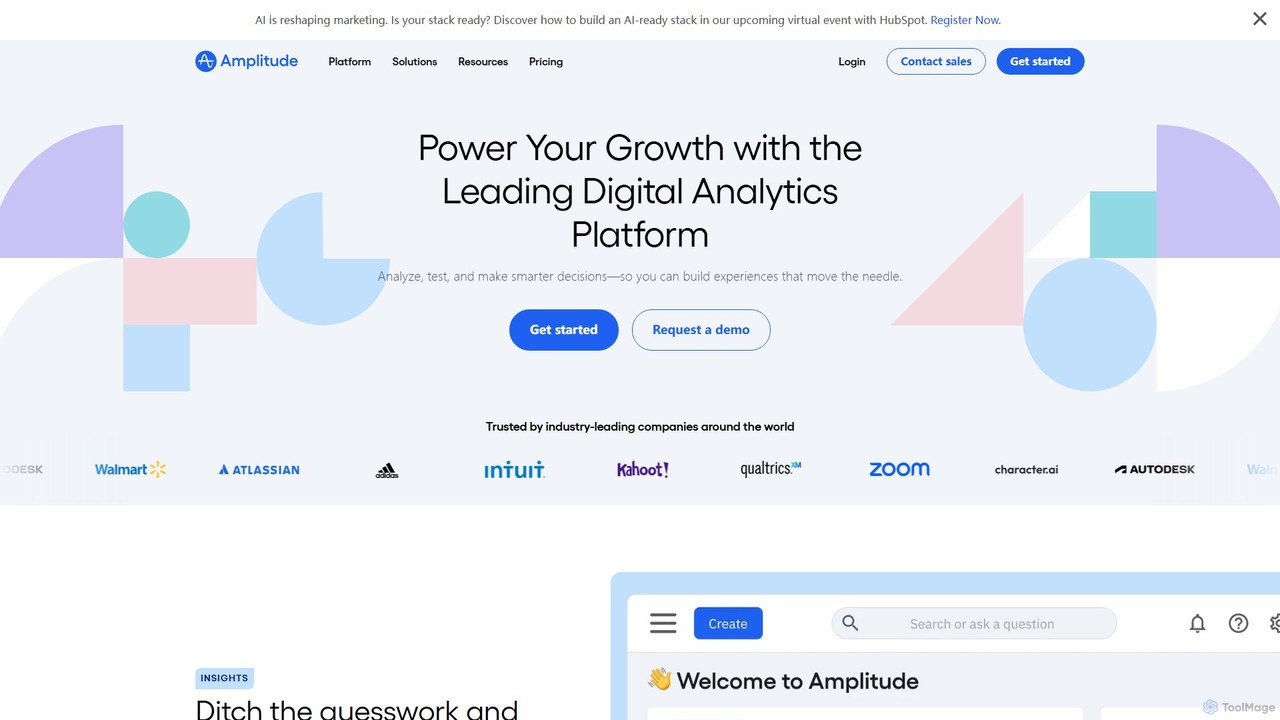
Amplitude is a leading digital analytics platform that uses AI to help businesses understand user behavior, optimize products, and drive growth. It provides a unified solution for product analytics, session replay, A/B testing, and feature management, enabling teams to make data-driven decisions and build better customer experiences.
Analytics
Dovetail
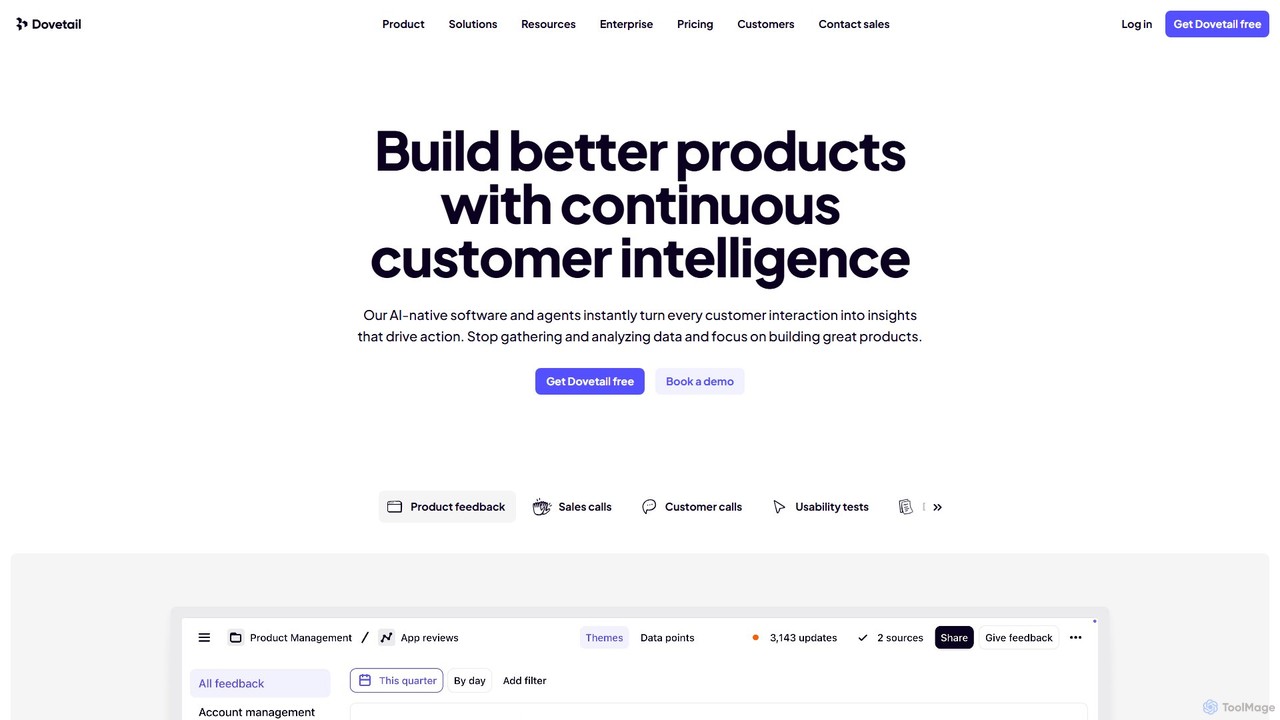
Dovetail is an AI-native customer insights hub designed to help teams build better products. It centralizes and analyzes all customer interactions—from sales calls and support tickets to surveys and usability tests. Using powerful AI, it automatically transcribes, summarizes, and identifies key themes, turning raw data into actionable intelligence. This allows product, research, and design teams to make faster, evidence-backed decisions and foster a truly customer-centric culture.
Customer Support
Fforward
Fforward is an advanced AI-powered platform designed for product managers, UX researchers, and founders to analyze customer interviews, uncover deep user insights, and accelerate product discovery. It automates the synthesis of qualitative data to identify key needs, themes, and actionable opportunities.
Customer Support
User Evaluation
User Evaluation is an AI-first user research platform designed to transform qualitative and quantitative data into actionable insights. It automates transcription, analysis, and reporting from audio, video, and text, enabling teams to understand their users faster and make data-driven decisions with confidence.
Customer Support
Depth
Depth is an AI Product Manager that automates product analytics, user session analysis, and feedback processing. It delivers actionable insights, UX improvement suggestions, and new feature ideas, helping teams build better products faster by eliminating manual data analysis.
Product Management
Prism Replay
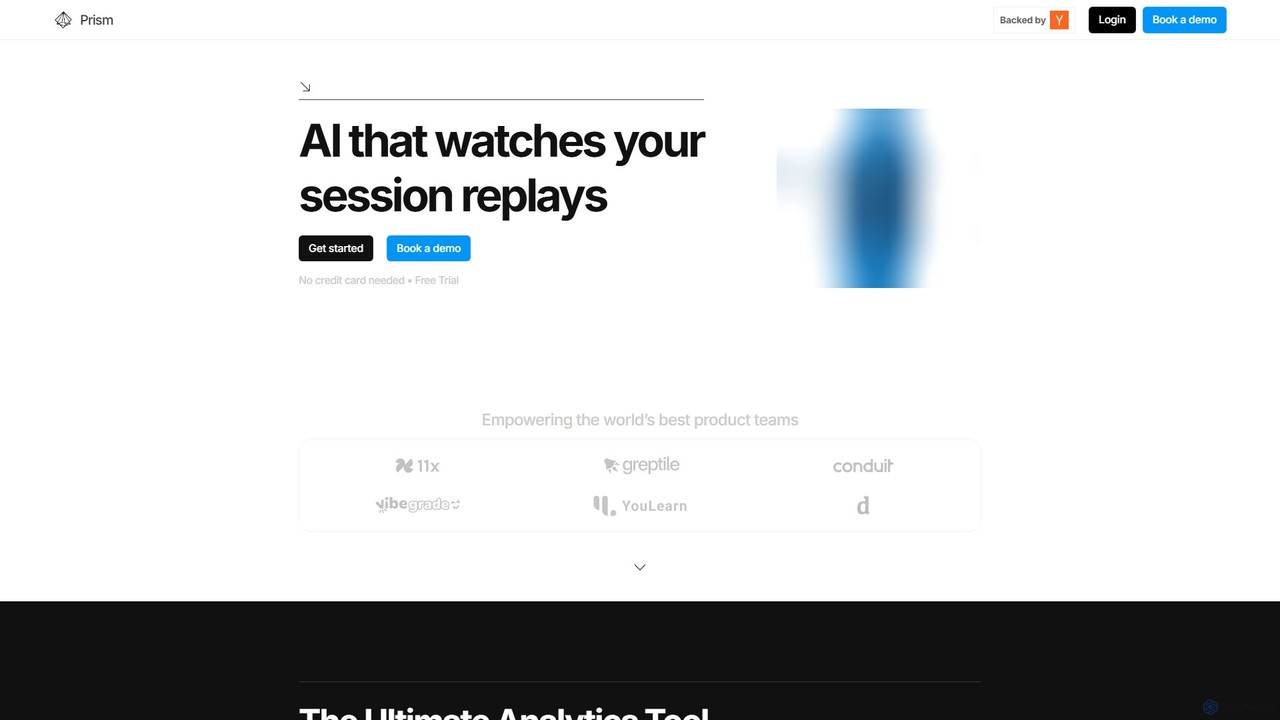
Prism Replay is an AI-native product analytics platform that automatically watches, summarizes, and analyzes user session replays. It provides actionable insights to help product teams optimize conversions, understand user behavior, and identify friction points without manual effort.
User Behavior
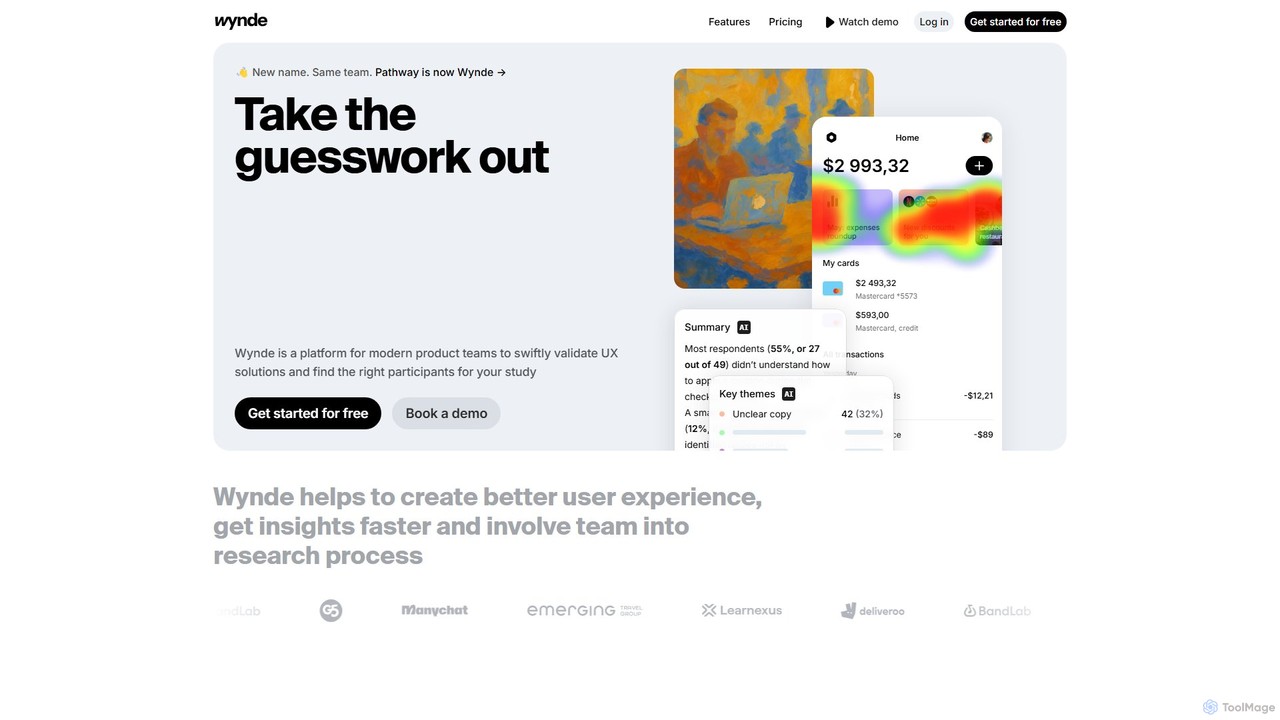
Wynde
Wynde is an AI-powered user research platform for product teams to validate UX solutions. It enables rapid creation of usability tests, surveys, and interviews for Figma prototypes and websites. Key features include AI-driven contextual follow-up questions, automated theme analysis, A/B testing, and access to a global panel with over 400 filters. Wynde helps teams get deeper insights faster and more affordably.
Prototyping
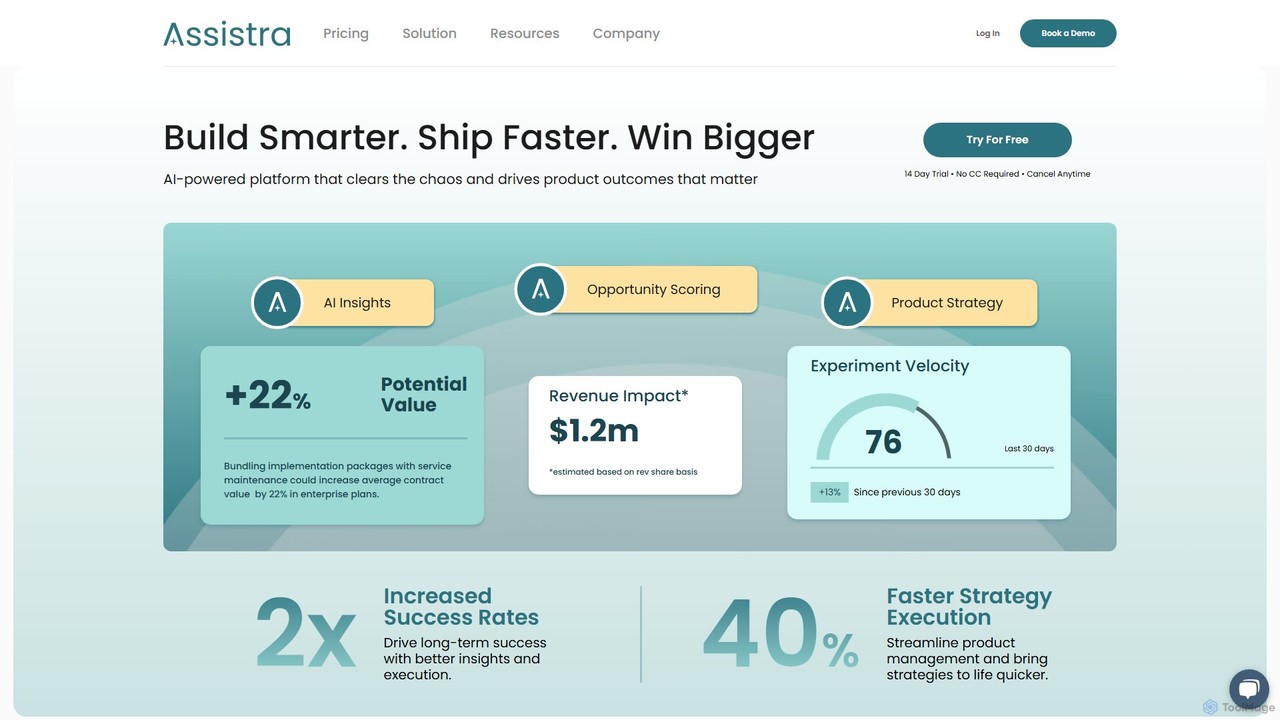
Assistra
Assistra is an AI-powered product management platform designed to streamline the entire product lifecycle. It helps teams turn customer feedback into actionable insights, build data-driven roadmaps, and accelerate strategy execution, ultimately leading to more successful product outcomes.
Generative Ai
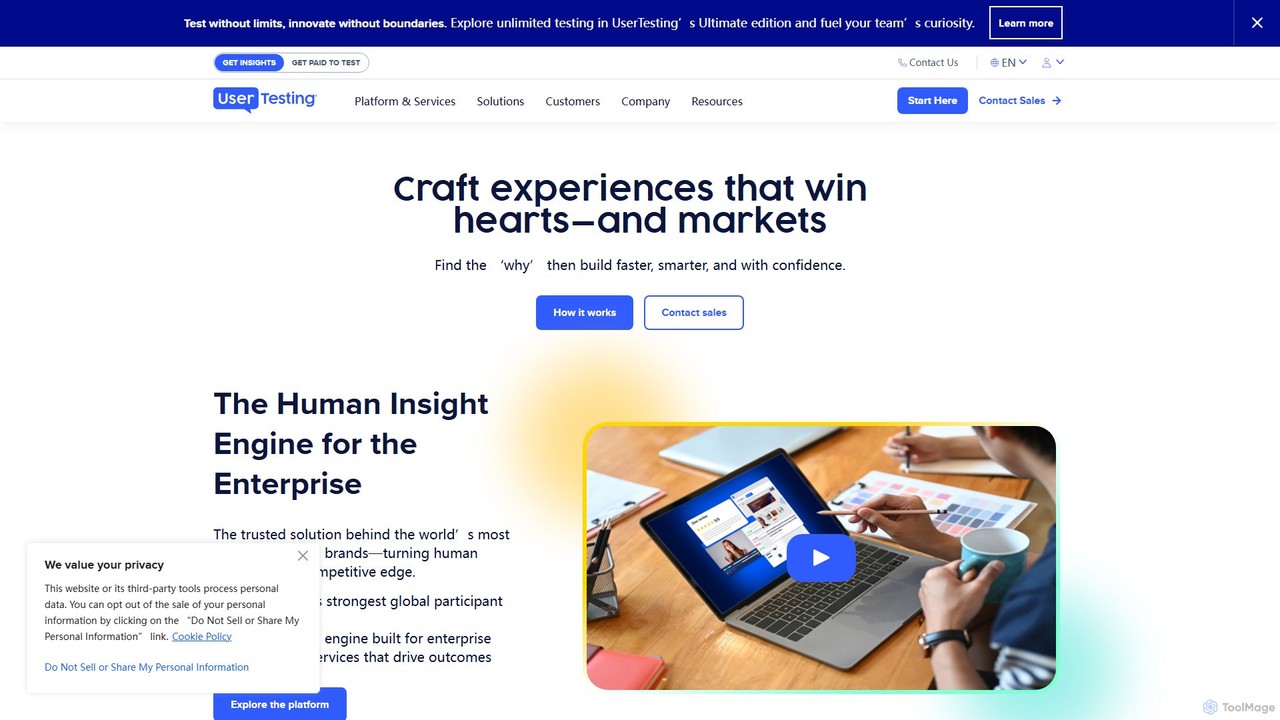
UserTesting
UserTesting is a leading human insight platform that enables organizations to see, hear, and understand real customer experiences. By leveraging a global network of participants and AI-powered analytics, it helps teams in product, marketing, and design gather video-first feedback to validate decisions, optimize experiences, and build customer-centric products with confidence.
Analytics
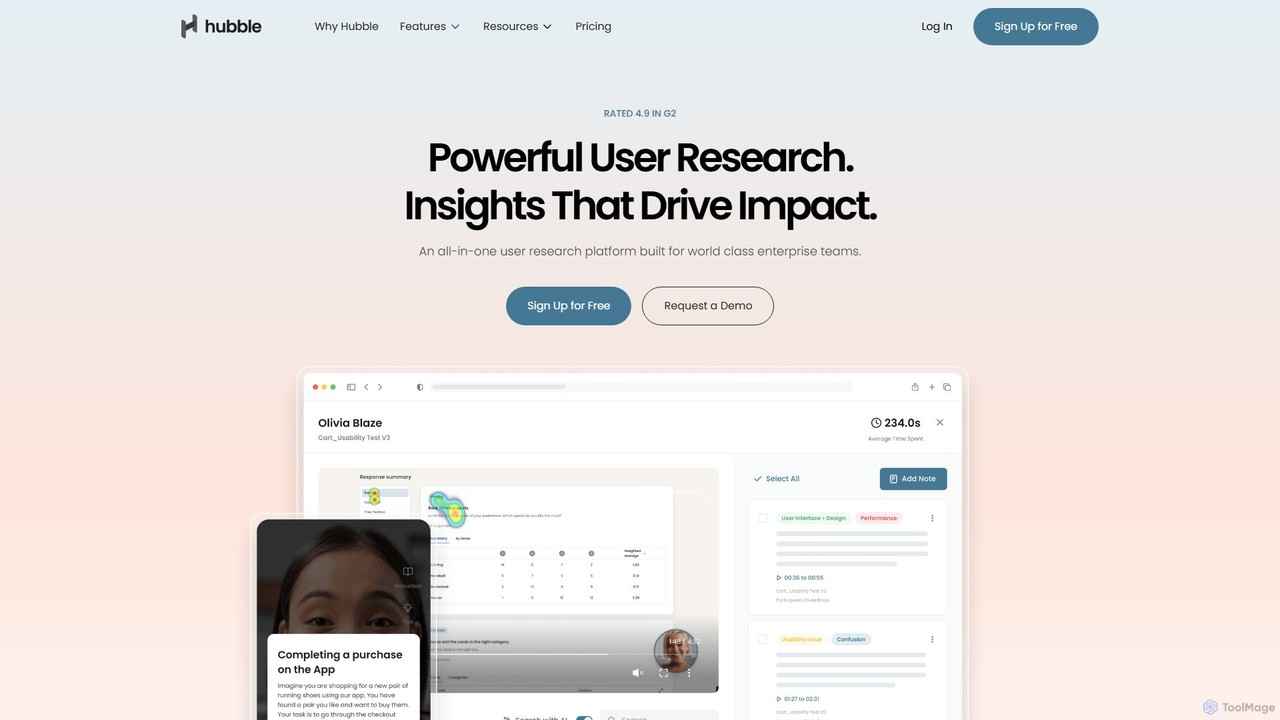
Hubble
Hubble is an all-in-one, AI-powered user research platform designed for enterprise teams. It enables rapid insights by streamlining the entire research process, from creating studies and recruiting participants to analyzing feedback. The platform supports various methodologies like prototype testing, surveys, and card sorting, using AI to summarize findings and accelerate decision-making.
Analytics
Feedbase
Feedbase is an AI-powered customer feedback platform that helps businesses listen, learn, and grow. By integrating a simple, minimalistic widget onto your website, you can effortlessly collect user feedback and use an AI-powered dashboard to gain actionable insights and analytics.
Analytics
PollPebble
PollPebble is an AI-powered platform for creating targeted microsurveys, designed for small businesses to gather valuable user insights. It allows seamless integration of surveys into products or websites, offers an intuitive creation process, and uses AI for in-depth sentiment analysis of responses. This helps businesses understand customer emotions and make data-driven decisions.
Analytics
PostHog
PostHog is an all-in-one, open-source product analytics platform for developers. It combines product analytics, session replay, feature flags, and A/B testing into a single tool, eliminating the need for a fragmented data stack. It's designed to help teams understand user behavior and build better products faster.
Customer Data Platform
OpenReplay
OpenReplay is a self-hostable, open-source session replay and product analytics suite. It empowers teams to understand user behavior, reproduce bugs faster, and optimize digital experiences. By providing visual context alongside technical data like console logs and network activity, OpenReplay helps engineers, product managers, and support teams identify frictions, improve conversion funnels, and enhance overall product usability while maintaining full control over customer data.
Live Chat
Condens
Condens is an AI-powered user research platform that centralizes all customer insights. It helps teams store, analyze, and share research data like interviews, feedback, and notes. With features like AI transcription, sentiment analysis, and collaborative tagging, Condens streamlines the qualitative analysis process, making it faster to uncover actionable insights and foster a customer-centric culture.
Customer Support