Neural4D is an advanced AI platform for 4D medical imaging analysis. It leverages deep learning to process spatio-temporal data from dynamic CT, MRI, and PET scans, enabling faster diagnostics, precise tumor tracking, and quantitative analysis of physiological functions for healthcare professionals and researchers.

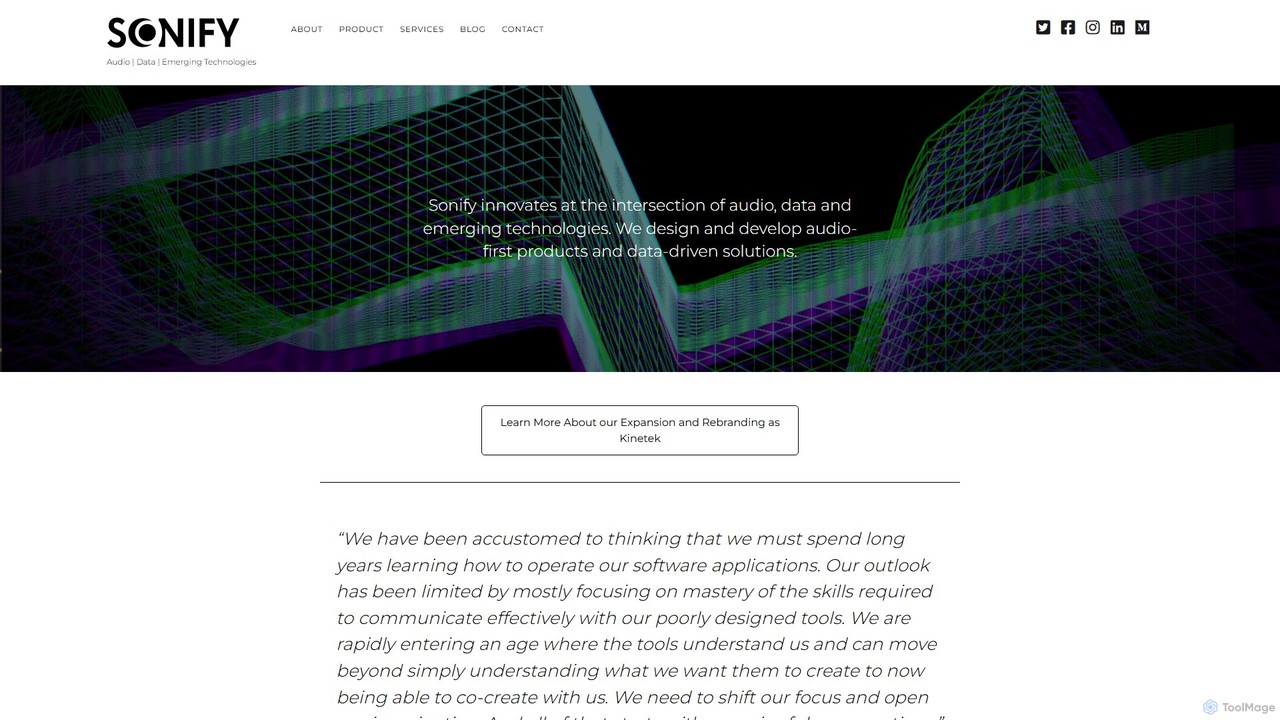
Sonify is an innovation studio that specializes in data sonification, using AI and emerging technologies to transform complex data into meaningful audio, music, and soundscapes. It focuses on making data more accessible, intuitive, and emotionally resonant for applications in research, art, and accessibility.
Product overview
Neural4D Product overview
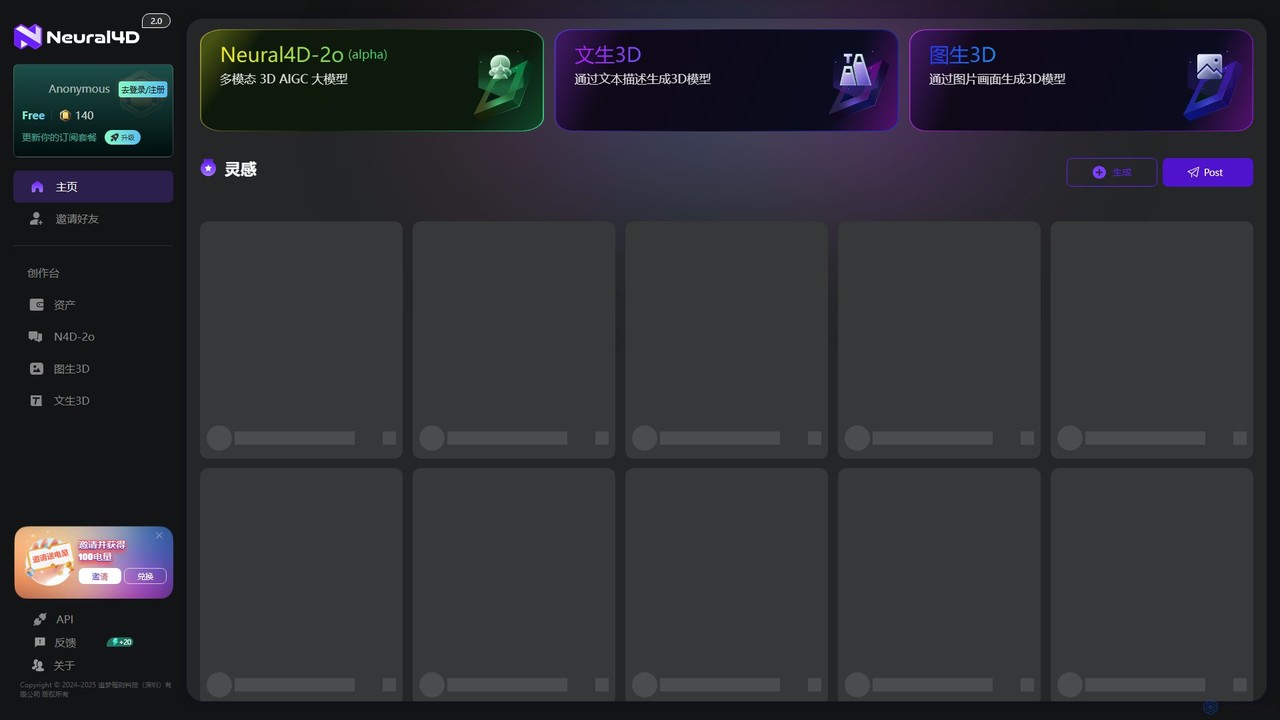
Neural4D is an advanced AI platform for 4D medical imaging analysis. It leverages deep learning to process spatio-temporal data from dynamic CT, MRI, and PET scans, enabling faster diagnostics, precise tumor tracking, and quantitative analysis of physiological functions for healthcare professionals and researchers.
Sonify Product overview
Sonify is an innovation studio that specializes in data sonification, using AI and emerging technologies to transform complex data into meaningful audio, music, and soundscapes. It focuses on making data more accessible, intuitive, and emotionally resonant for applications in research, art, and accessibility.
Detailed feature comparison
| Feature | Neural4D | Sonify |
|---|---|---|
| Primary category | Data Visualization | Sonification |
| Added | 2025-08-06 | 2025-08-01 |
| Pricing | Paid | Not verified |
| Official website | www.neural4d.com | www.sonify.io |
| Product type | Website | Website |
| Performance data | ||
| User rating | Not verified | Not verified |
| Comments | 0 | 0 |
| Monthly visits | 427.5K | 2.8K |
| Monthly growth | 39.7% | -29.8% |
| Favorites | 98 | 102 |
| Details | View details | View details |
Neural4D vs Sonify monthly traffic
Compare Neural4D and Sonify by monthly reach, traffic trend, visit depth, top regions, and acquisition sources.
How to interpret the traffic data
In the Neural4D vs Sonify monthly traffic comparison, Neural4D currently shows 427.5K visits and Sonify shows 2.8K; Neural4D has about 153.5 times the visible traffic of Sonify, an absolute difference of about 424.7K visits. This reflects visible reach, not feature quality or paid users.
Both tools provide verified traffic details, so monthly trends, visit depth, regions, and acquisition sources can be compared on the same basis.
Neural4D monthly traffic:
Latest traffic
Monthly traffic trend
- 2025/9: 2.2K Monthly visits
- 2026/1: 25K Monthly visits
- 2026/2: 55.1K Monthly visits
- 2026/3: 138.4K Monthly visits
- 2026/4: 306K Monthly visits
- 2026/5: 427.5K Monthly visits
Top regions
Top 5 countries/regions
| Country/region | Percentage | Traffic |
|---|---|---|
| 🇨🇳China | 36.78% | 157.2K |
| 🇺🇸United States | 33.97% | 145.2K |
| 🇷🇺Russia | 17.49% | 74.8K |
| 🇮🇳India | 6.41% | 27.4K |
| 🇧🇷Brazil | 5.35% | 22.9K |
Traffic sources
| Source type | Percentage | Traffic |
|---|---|---|
| Direct | 81.72% | 349.4K |
| Referral | 17.96% | 76.8K |
| 0.32% | 1.4K |
Search keywords
Sonify monthly traffic:
Latest traffic
Monthly traffic trend
- 2025/9: 3K Monthly visits
- 2026/1: 1.4K Monthly visits
- 2026/2: 2.3K Monthly visits
- 2026/3: 1.6K Monthly visits
- 2026/4: 4K Monthly visits
- 2026/5: 2.8K Monthly visits
Top regions
Top 5 countries/regions
| Country/region | Percentage | Traffic |
|---|---|---|
| 🇺🇸United States | 100% | 2.8K |
Search keywords
Usage comparison
Compare the core capabilities of Neural4D and Sonify
Neural4D Core features
Sonify Core features
Use cases
Neural4D Use cases
Sonify Use cases
Neural4D vs Sonify:In-depth comparison and selection guidance
First decide whether the products solve the same kind of need
This in-depth Neural4D vs Sonify comparison uses only the product records, taxonomy, audience, traffic, and community signals available on this page. Neural4D is primarily listed under “Data Visualization”, while Sonify is primarily listed under “Sonification”, so the first decision is whether your actual task matches their recorded scope.
The structured fields currently show these decision-relevant differences: Primary category (Neural4D: Data Visualization; Sonify: Sonification); Pricing (Neural4D: Paid; Sonify: Not disclosed); Monthly visits (Neural4D: 427.5K; Sonify: 2.8K); Monthly growth (Neural4D: 39.7%; Sonify: -29.8%); Favorites (Neural4D: 98; Sonify: 102). These facts are more useful for selection than brand visibility alone.
What market visibility and monthly traffic mean
In the Neural4D vs Sonify monthly traffic comparison, Neural4D currently shows 427.5K visits and Sonify shows 2.8K; Neural4D has about 153.5 times the visible traffic of Sonify, an absolute difference of about 424.7K visits. This reflects visible reach, not feature quality or paid users.
Both tools provide verified traffic details, so monthly trends, visit depth, regions, and acquisition sources can be compared on the same basis.
If public market visibility is an important first-pass criterion, investigate Neural4D first. The final choice should still follow taxonomy, use case, and a real trial because higher traffic does not prove broader capabilities or better workflow fit.
Product positioning, use cases, and roles
Neural4D and Sonify currently overlap in shared categories: Data Visualization; shared tags: data visualization. This can place both on the same shortlist, but it does not prove equal implementation, depth, or cost.
Neural4D's unique categories/tags are Medical Imaging, Automation, 4D analysis, AI doctor, cardiology, CT scan, deep learning, and diagnostics; Sonify's are Sonification, Accessibility, accessibility, ai music, audio data, data sonification, Data Storytelling, and data to music. These unique fields are the strongest differentiators: validate the product whose recorded scope matches the task instead of following traffic alone.
What ratings, comments, and favorites can tell you
Neural4D has no verified rating, 0 comments, 98 favorites, and 129 likes;Sonify has no verified rating, 0 comments, 102 favorites, and 117 likes。
Neither product has enough rating or comment samples for a credible reputation ranking.
Selection guidance by actual need
When to evaluate Neural4D first
Put Neural4D on the priority trial list when the task aligns with “Data Visualization” and especially Medical Imaging, Automation, 4D analysis, AI doctor, cardiology, and CT scan. This follows recorded positioning and does not imply unlisted capabilities are absent.
Neural4D also currently records: pricing is paid, product type is website, 427.5K verified monthly visits, no verified user rating. Verify any hard requirement around price, platform, or reach before trial, and do not let sparse review data substitute for testing.
When to evaluate Sonify first
Put Sonify on the priority trial list when the task aligns with “Sonification” and especially Sonification, Accessibility, accessibility, ai music, audio data, and data sonification. This follows recorded positioning and does not imply unlisted capabilities are absent.
Sonify also currently records: pricing is not verified, product type is website, 2.8K verified monthly visits, no verified user rating. Verify any hard requirement around price, platform, or reach before trial, and do not let sparse review data substitute for testing.
How to validate the recommendation before deciding
The available data describes positioning, public visibility, and community signals, but it cannot prove output quality, speed, integration effort, privacy, or long-term cost in your workflow. Before deciding, run the same representative tasks in Neural4D and Sonify, then record completion time, accuracy, manual corrections, and the real paid threshold. A like-for-like trial turns this comparison into a defensible adoption decision.
Comparison FAQ
How should I choose between Neural4D and Sonify?
Where does this comparison data come from?
What do unknown fields mean?
Related AI tools

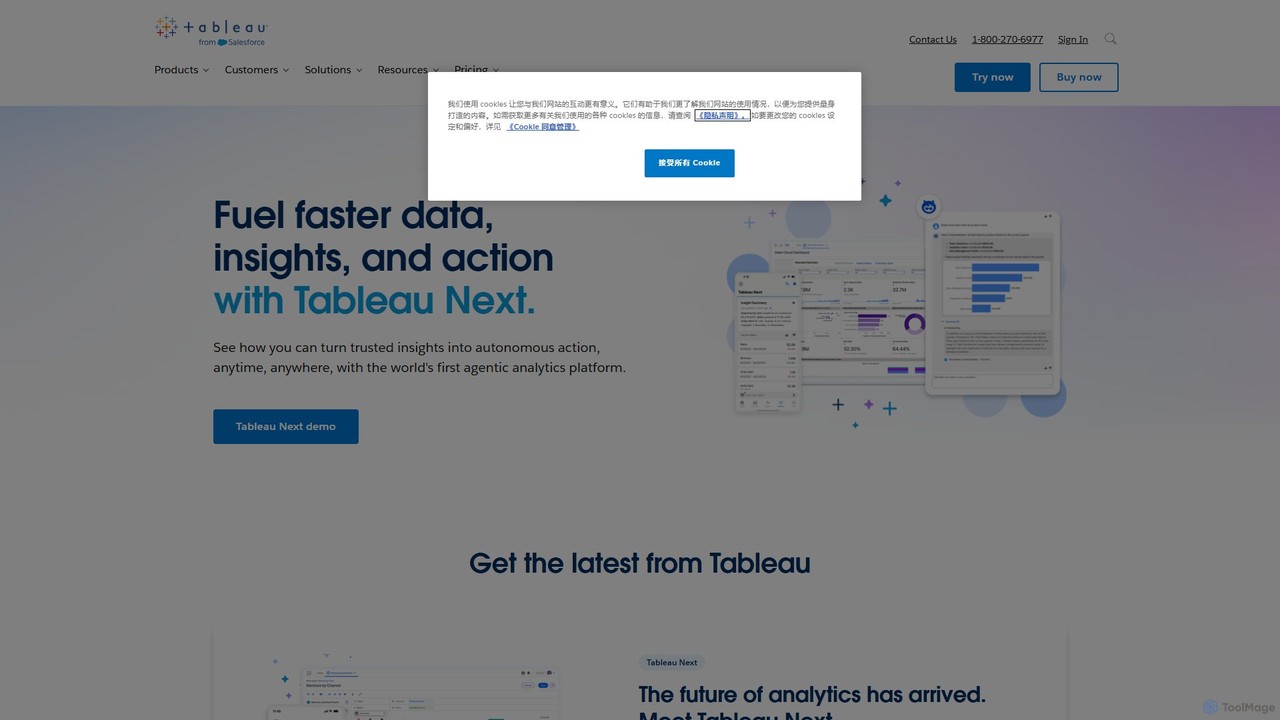
Tableau
Tableau is a leading AI-powered business intelligence and analytics platform that helps people see and understand data. It enables users to create interactive dashboards, perform complex data analysis, and share insights across their organization, enhanced by AI features like Tableau Agent for accelerated decision-making.
Business Intelligence
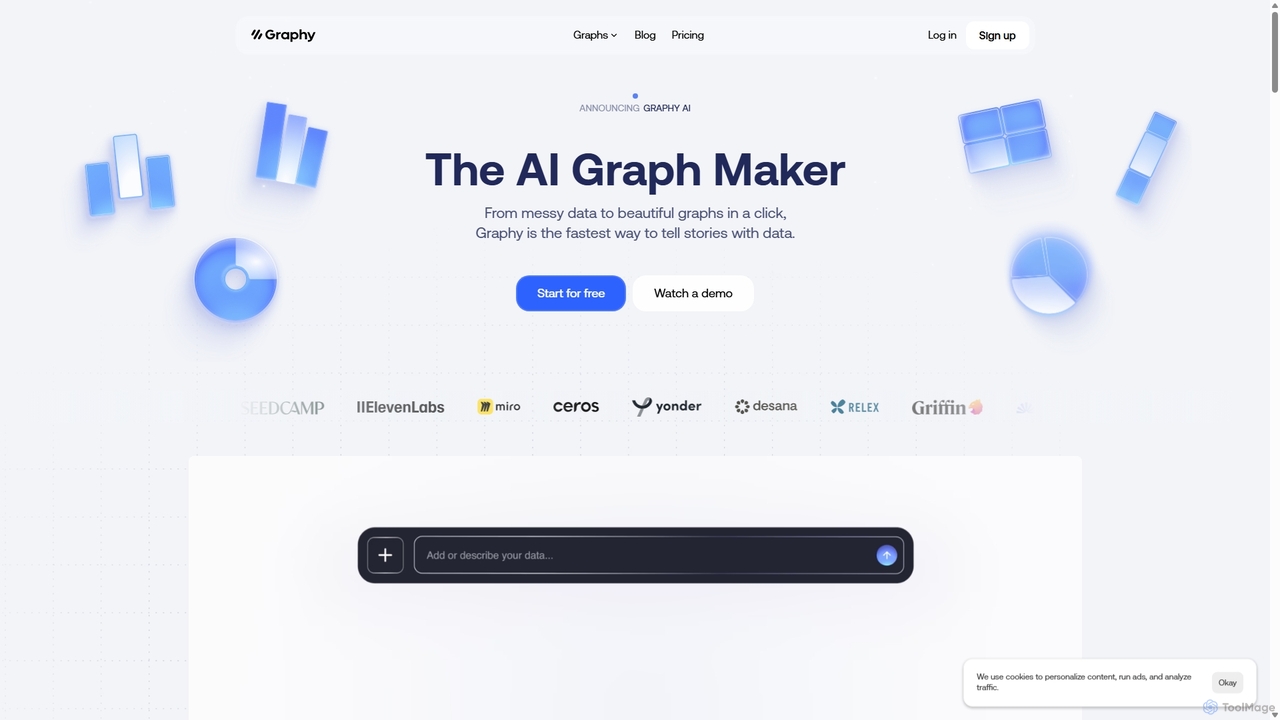
Graphy
Graphy is an AI-powered data visualization tool that transforms raw data into beautiful, interactive charts and graphs in seconds. It simplifies data storytelling by automatically identifying key insights, allowing users to chat with their data, and offering extensive customization. Ideal for marketers, analysts, and teams who need to create compelling visual reports and presentations without complex software.
3D
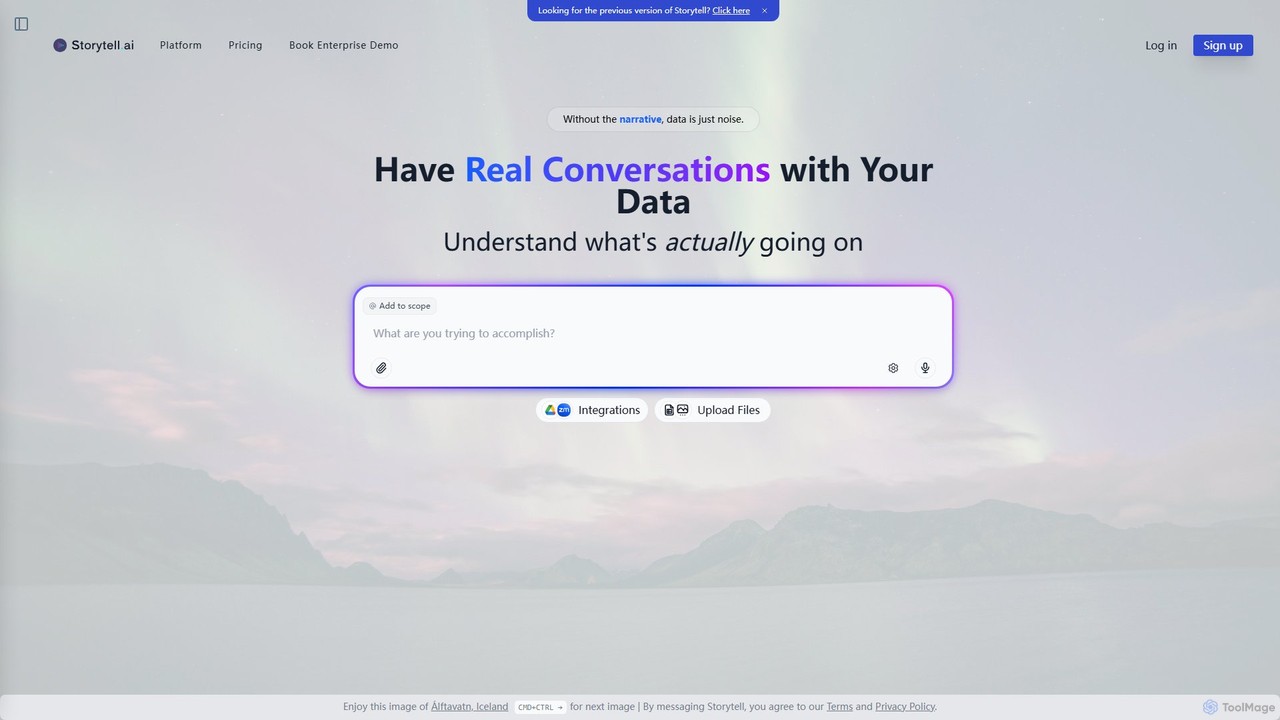
Storytell.ai
Storytell.ai is a conversational AI platform that transforms raw data into understandable narratives. Interact with your data through natural language to uncover insights, generate summaries, and understand complex information without needing technical expertise. Simply upload files or connect data sources and start asking questions.
Business Intelligence
Lumenore
Lumenore is an AI-powered, no-code business intelligence and data analytics platform designed to transform complex data into actionable insights. It offers a complete analytics workspace with advanced features like Gen AI-powered Natural Language Query (NLQ), automated insights, and data storytelling, enabling businesses to make faster, informed decisions without requiring deep technical expertise.
3D
VisActor
VisActor is an open-source, narrative-oriented intelligent visualization solution from ByteDance. It provides a comprehensive suite of tools, including VChart and VTable, to transform data into compelling visual stories. With its AI-powered component, VMind, it simplifies chart creation and enables dynamic, cross-platform data presentations.
Libraries & Frameworks
Graphitup
Graphitup is an AI-powered data visualization tool that transforms raw data from Excel or Google Sheets into stunning, on-brand charts and interactive dashboards. It offers robust theming, extensive customization, and easy publishing options, enabling businesses and creators to tell compelling data stories and build lasting digital assets.
3D
Columns
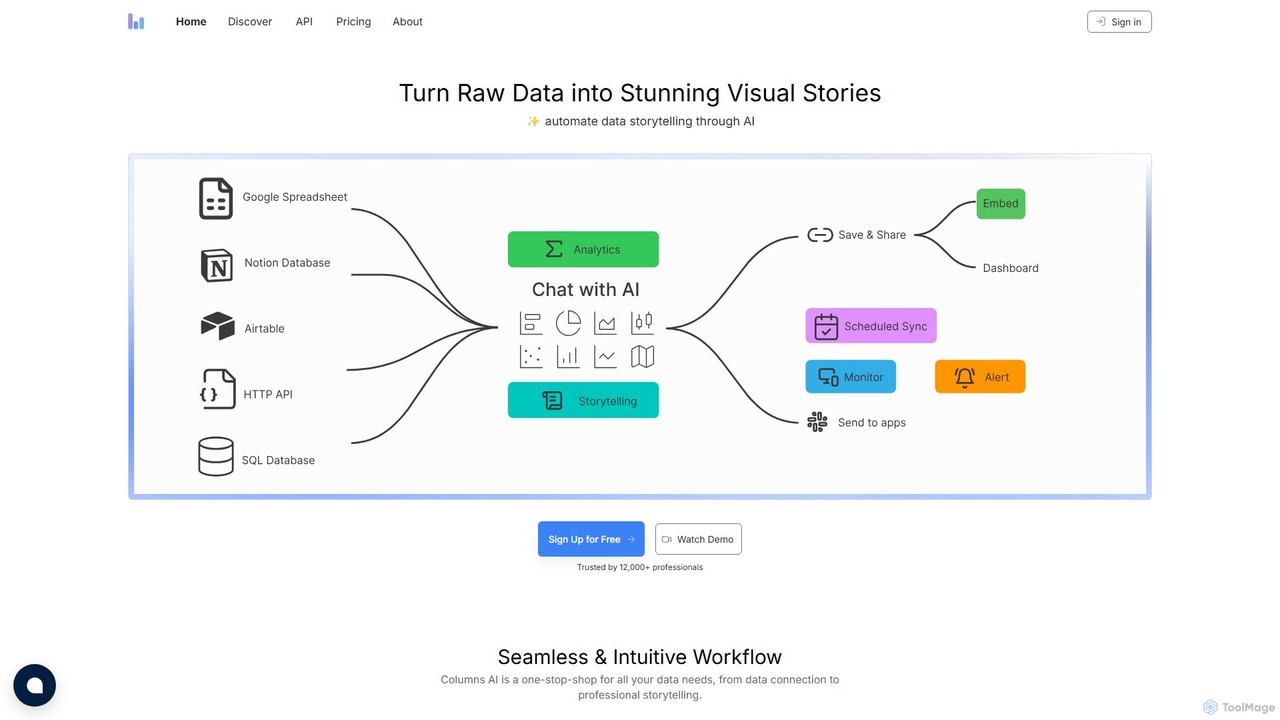
Columns is an AI-powered data storytelling platform that transforms raw data into stunning visual narratives. Using natural language, users can ask questions, generate insightful charts, and create professional presentations. It connects to various data sources like Google Sheets, SQL databases, and APIs, automating the entire process from data connection to visual storytelling.
Analytics
Othor AI
Othor AI is a no-code business intelligence platform that transforms your data into actionable insights in seconds. It automatically generates narrative-driven reports, smart charts, and predictive analytics, enabling anyone in your organization to make faster, data-driven decisions without technical expertise. Connect your data sources and get instant dashboards and executive summaries.
Business Intelligence
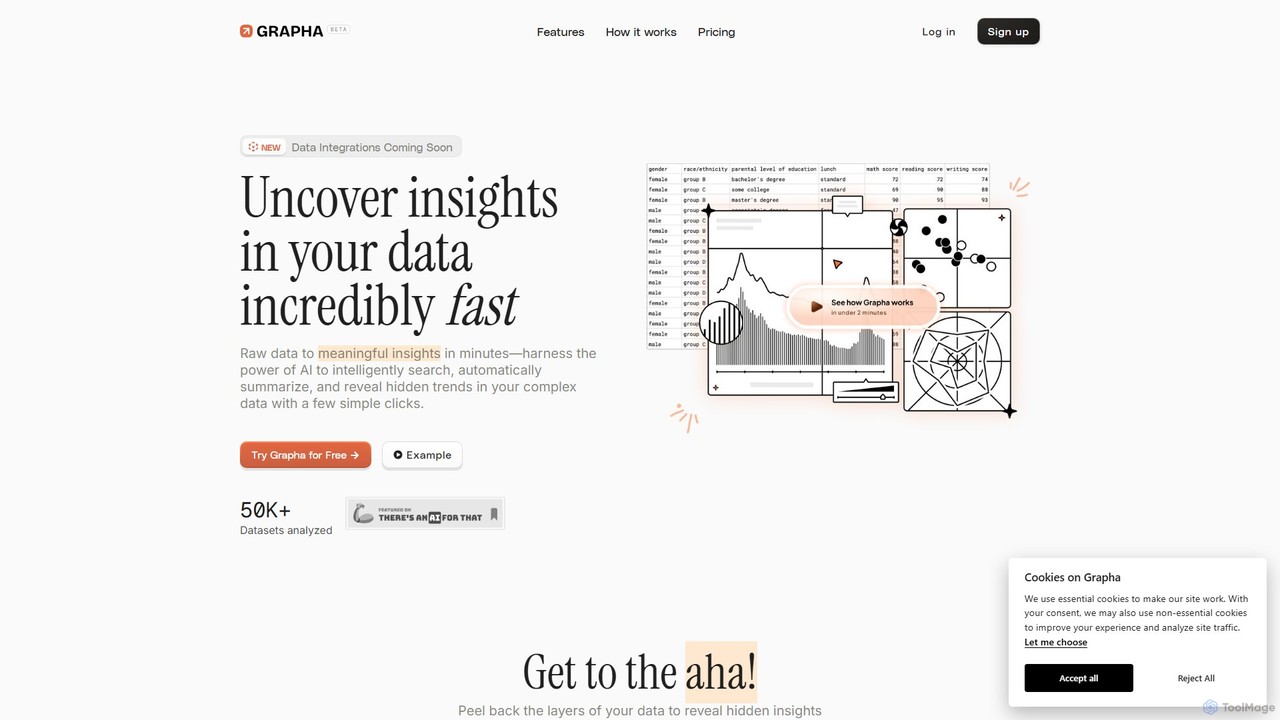
Grapha.ai
Grapha.ai is an AI-powered data exploration tool that transforms complex datasets into clear, actionable insights. Using a natural language copilot, users can search, summarize, and visualize data without any coding. It's designed for everyone, from business analysts to small business owners, to uncover hidden trends and make data-driven decisions in minutes.
Business Intelligence
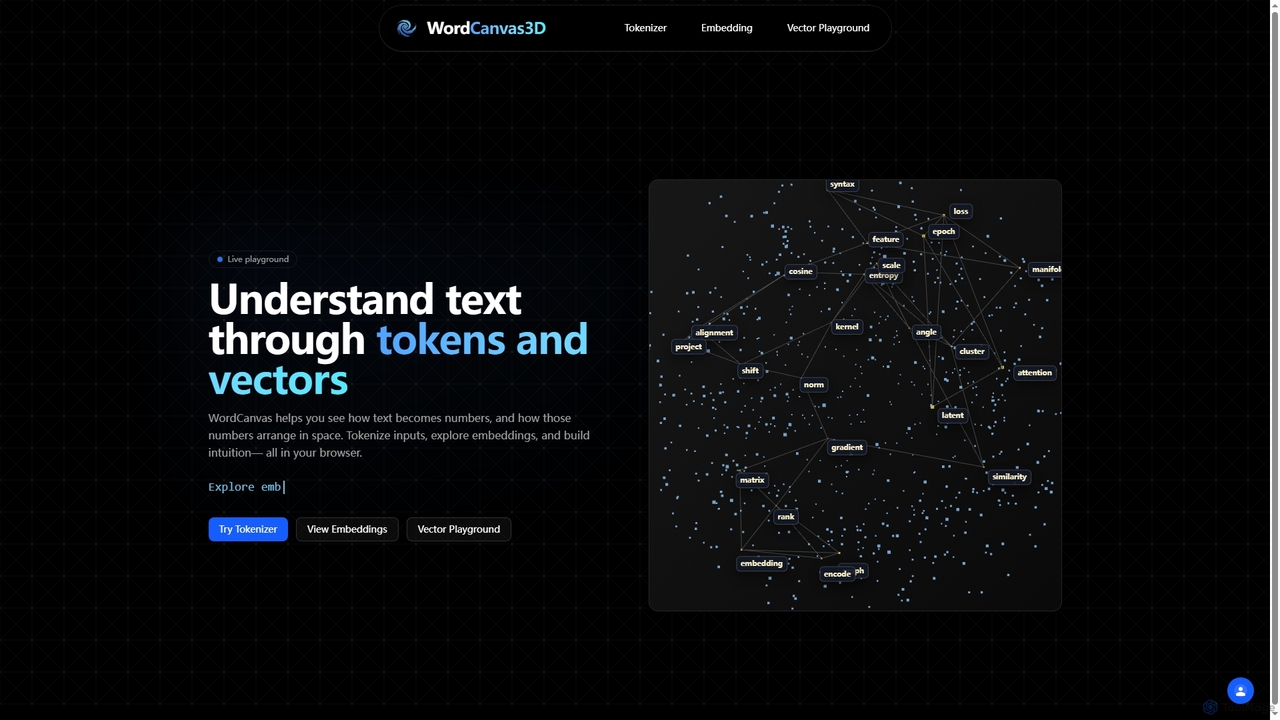
WordCanvas3D
WordCanvas3D is an interactive web-based tool designed to visualize and understand core natural language processing concepts like text tokenization, word embeddings, and vector arithmetic. It offers a live playground to explore how text transforms into numerical representations and their spatial relationships.
Natural Language Processing
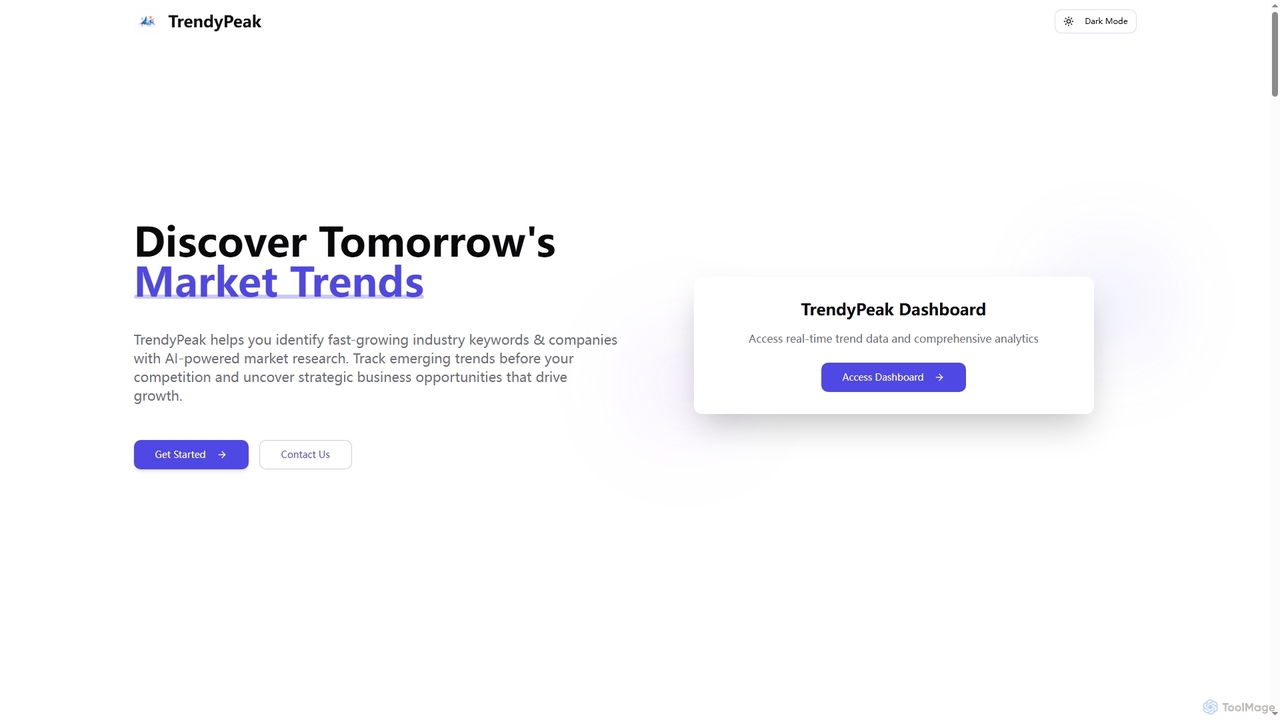
TrendyPeak
TrendyPeak is an AI-powered market intelligence platform designed to help businesses discover and track fast-growing industry keywords and companies. It provides real-time trend data, comprehensive analytics, and actionable insights to identify strategic growth opportunities and gain a competitive advantage across over 30 industries.
Content Strategy
vizbox
vizbox is an AI-powered data visualization platform that transforms raw data into insightful charts, graphs, and interactive dashboards. Users can simply upload data or use natural language prompts to generate compelling visuals, making data analysis accessible to everyone, regardless of technical skill.
No Code
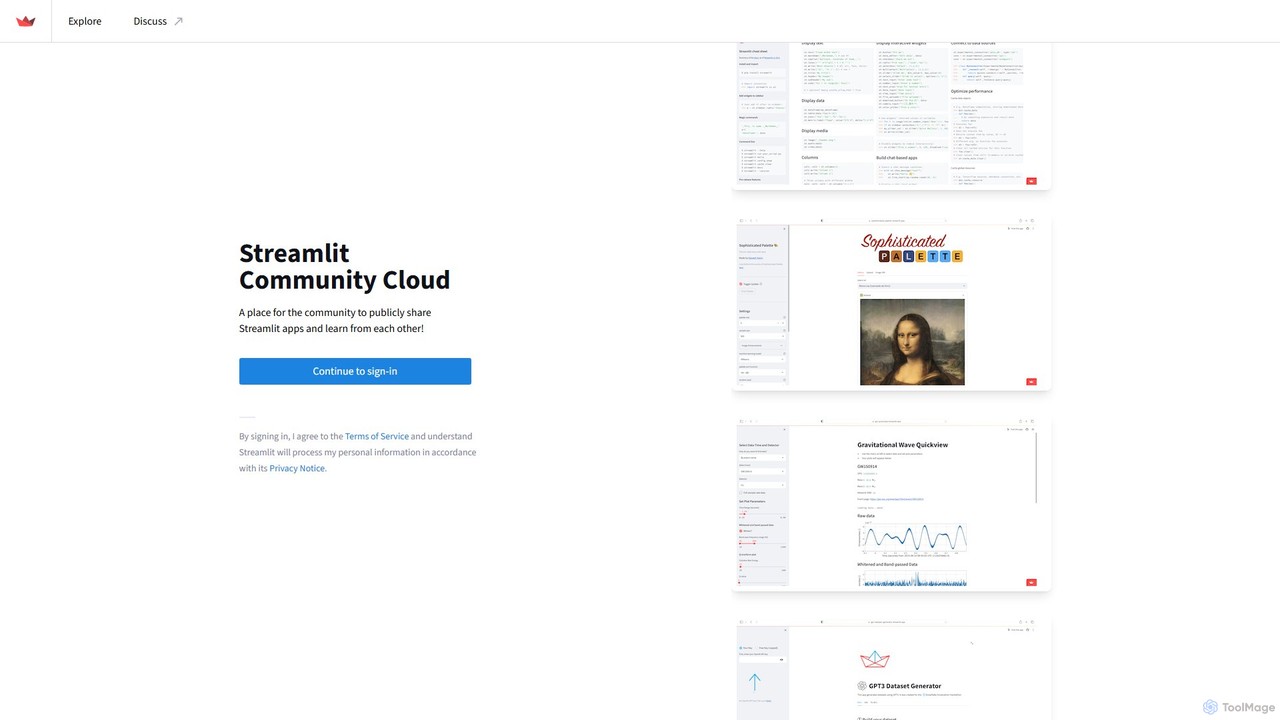
Streamlit
Streamlit is an open-source Python framework that enables developers and data scientists to build and share beautiful, custom web apps for machine learning and data science in minutes. The Streamlit Community Cloud provides a free platform to deploy, manage, and share these public applications with the world, fostering a collaborative environment for innovation.
Data Visualization
marimo
marimo is an open-source reactive Python notebook for modern data science and AI. It offers a reproducible, Git-friendly, and interactive environment where notebooks are pure Python scripts. Features include built-in AI assistance, SQL cells, and the ability to share notebooks as web apps, streamlining the workflow from experiment to production.
Data Visualization
victordibia
A comprehensive resource hub by Victor Dibia, a leading researcher in Applied ML and HCI. It features open-source AI tools like AutoGen Studio and LIDA, in-depth articles, research papers, and talks on generative AI, multi-agent systems, and human-computer interaction. A valuable platform for developers, researchers, and AI enthusiasts.
Data Visualization