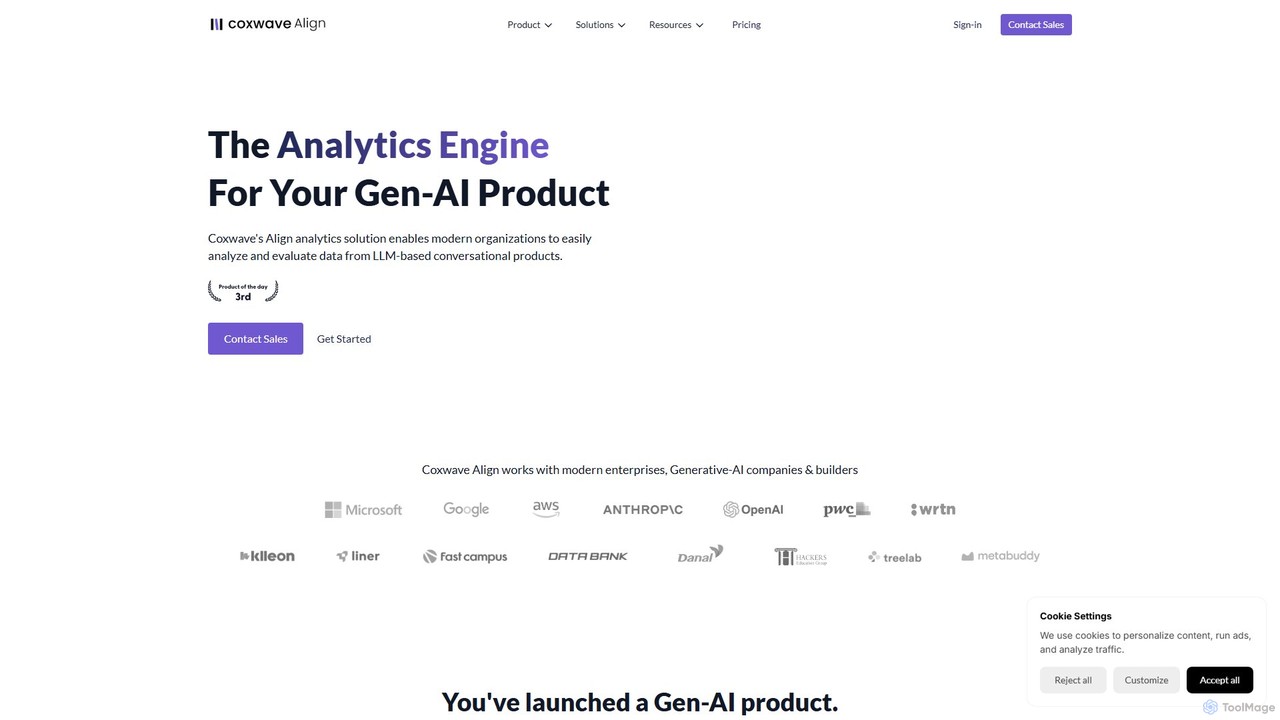
LLM Observability tools are a specialized class of software for monitoring, debugging, and analyzing applications built on Large Language Models. They go beyond traditional monitoring by providing deep insights into the entire lifecycle of an LLM request, from the initial prompt to the final generated response. This allows teams to track performance metrics like latency and token usage, evaluate output quality, and manage operational costs effectively. These platforms are essential for moving LLM-powered applications from prototype to reliable production systems.
Core Features
- Request & Response Tracing: Log and visualize the complete path of every LLM interaction, including intermediate steps and tool calls.
- Performance Monitoring: Track key metrics such as latency, time-to-first-token, and throughput to identify bottlenecks.
- Cost Management: Analyze token consumption by model, user, or feature to control API spending.
- Quality Evaluation: Collect user feedback and run automated evaluations to measure metrics like relevance, toxicity, and hallucination rates.
- Debugging & Root Cause Analysis: Quickly identify the source of errors or poor responses by inspecting detailed traces and metadata.
Use Cases
These tools are critical for developers and MLOps teams building production-grade AI applications like customer support chatbots, content generation platforms, and complex agent-based systems. They help ensure reliability, control costs, and continuously improve the user experience.
How to Choose
When selecting an LLM Observability tool, consider its integration with your existing tech stack (e.g., LangChain, LlamaIndex), the depth of its analytics and visualization capabilities, its support for various LLM providers, and its pricing model based on data volume or features.