Hotjar
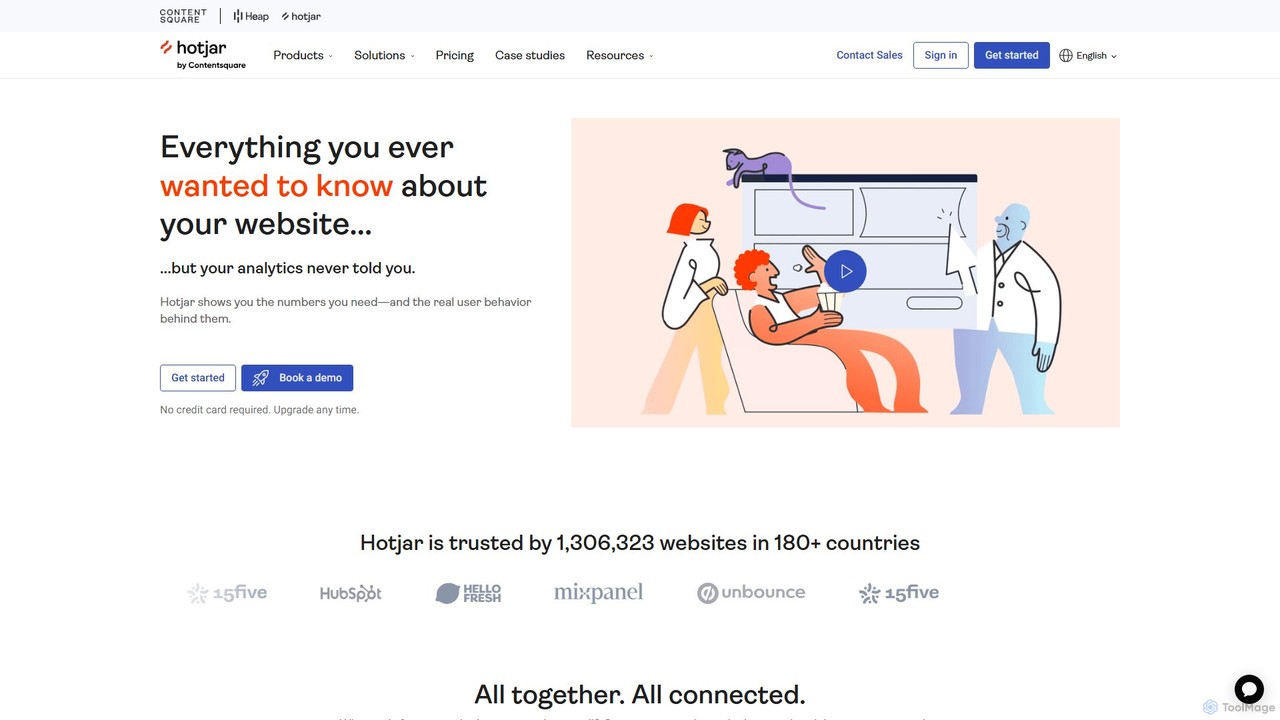
Hotjar is an all-in-one product experience insights platform that reveals the online behavior and voice of your users. …
Hotjar is an all-in-one product experience insights platform that reveals the online behavior and voice of your users. Through tools like Heatmaps, Session Recordings, Surveys, and Feedback, it helps you understand what users do on your site and why, enabling you to improve user experience and conversion rates.
Fullstory
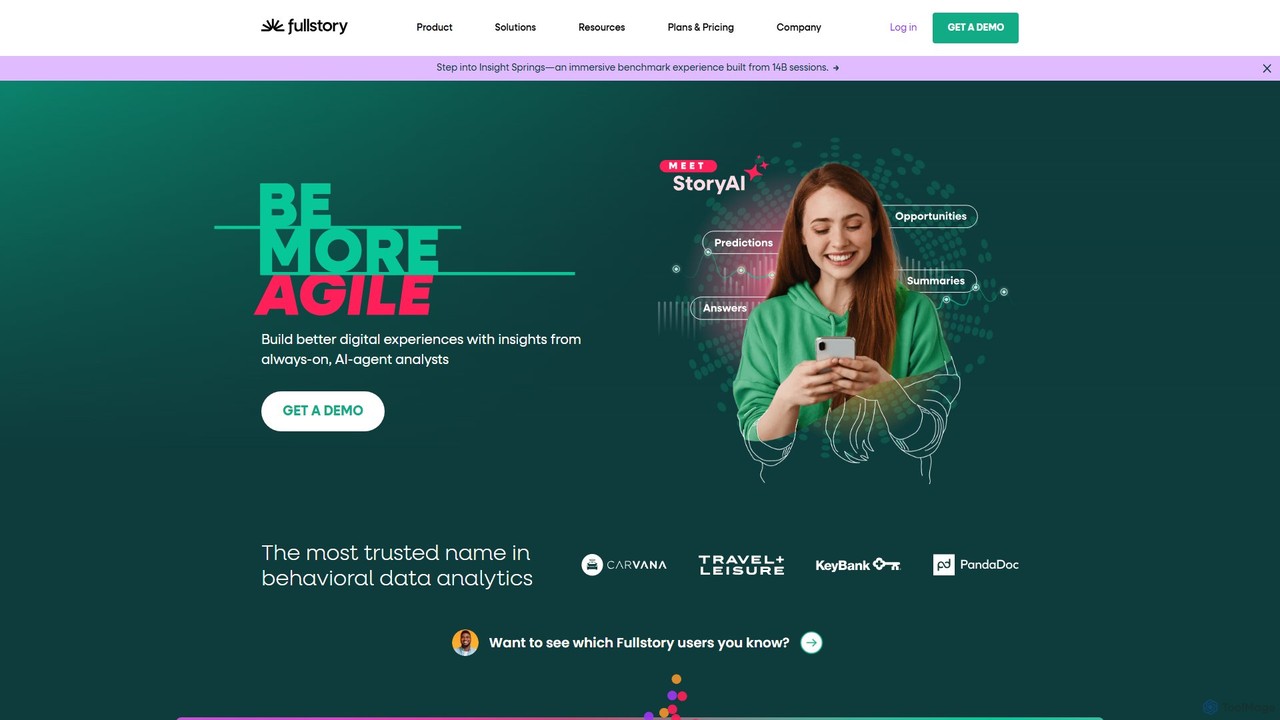
Fullstory is a leading Digital Experience Intelligence (DXI) platform that helps businesses understand and improve their user experience …
Fullstory is a leading Digital Experience Intelligence (DXI) platform that helps businesses understand and improve their user experience on web and mobile. It captures every click, scroll, and interaction, providing session replays, heatmaps, and AI-powered analytics to identify user friction, uncover bugs, and optimize conversion funnels.
About User Behavior Analytics
User Behavior Analytics (UBA) tools are AI-powered solutions designed to collect, analyze, and visualize how users interact with digital products like websites, mobile apps, and software. These tools leverage advanced machine learning to uncover patterns, predict future actions, and provide deep insights into user journeys, beyond surface-level metrics. By understanding user intent and friction points, UBA helps optimize user experience, improve conversion rates, and drive product growth.
Core Features
- Session Replay: Records and reconstructs individual user sessions to visually understand their exact interactions.
- Heatmaps & Click Tracking: Visualizes user attention and engagement patterns on pages through clicks, scrolls, and mouse movements.
- Funnel Analysis: Maps out user journeys and identifies drop-off points in critical conversion funnels.
- Predictive Analytics: Uses AI to forecast user behavior, such as churn risk or conversion likelihood, based on historical data.
- Automated Anomaly Detection: AI automatically flags unusual user activities or performance deviations that require attention.
Applicable Scenarios
UBA tools are crucial for product managers, UX designers, marketers, and data analysts aiming to enhance digital product performance. They are used to pinpoint usability issues on e-commerce sites, understand engagement with new app features, and optimize content consumption on media platforms.
How to Choose
When selecting a UBA tool, consider its data collection capabilities (e.g., real-time vs. batch), the depth of AI-driven insights (e.g., predictive modeling, automated segmentation), integration with existing analytics and marketing stacks, and compliance with data privacy regulations like GDPR or CCPA. Evaluate the visualization options and reporting flexibility to ensure actionable insights.
User Behavior AnalyticsUse Cases
Optimizing E-commerce Conversion Funnels
An e-commerce manager uses UBA to analyze the checkout process on their website. By reviewing session replays and funnel analysis, they identify that many users abandon their carts at the shipping information step due to a confusing form field. They then redesign the form, leading to a 15% increase in completed purchases.
Identifying UX Pain Points in Mobile Apps
A mobile app developer utilizes UBA heatmaps and touch gesture analysis to understand user interaction with a new feature. They discover that users frequently tap a non-interactive image, mistaking it for a button. This insight prompts a UI adjustment, significantly reducing user frustration and improving feature adoption.
Predicting Customer Churn in SaaS Platforms
A SaaS company's customer success team employs UBA's predictive analytics to identify users at high risk of churning. The AI models analyze usage patterns, feature engagement, and login frequency. This allows the team to proactively reach out to at-risk customers with targeted support or offers, reducing churn by 10%.
Personalizing User Journeys on Content Platforms
A content platform uses UBA to understand individual user preferences and content consumption habits. By analyzing scroll depth, time on page, and click paths, the AI recommends personalized articles and videos. This leads to a 20% increase in average session duration and higher content engagement.
Analyzing A/B Test Results for Website Redesigns
A marketing team conducts an A/B test for a website redesign. Beyond conversion rates, they use UBA to compare user behavior between the old and new designs. Session replays and heatmaps reveal *why* one version performs better, providing deeper insights than just quantitative metrics, informing future design iterations.
Understanding Feature Adoption in Product Launches
A product team launches a new feature and uses UBA to monitor its adoption. By segmenting users and analyzing their interactions with the new functionality, they can identify onboarding friction or areas where users struggle. This data helps them iterate quickly, improving the feature's usability and overall success rate.