
Freemium
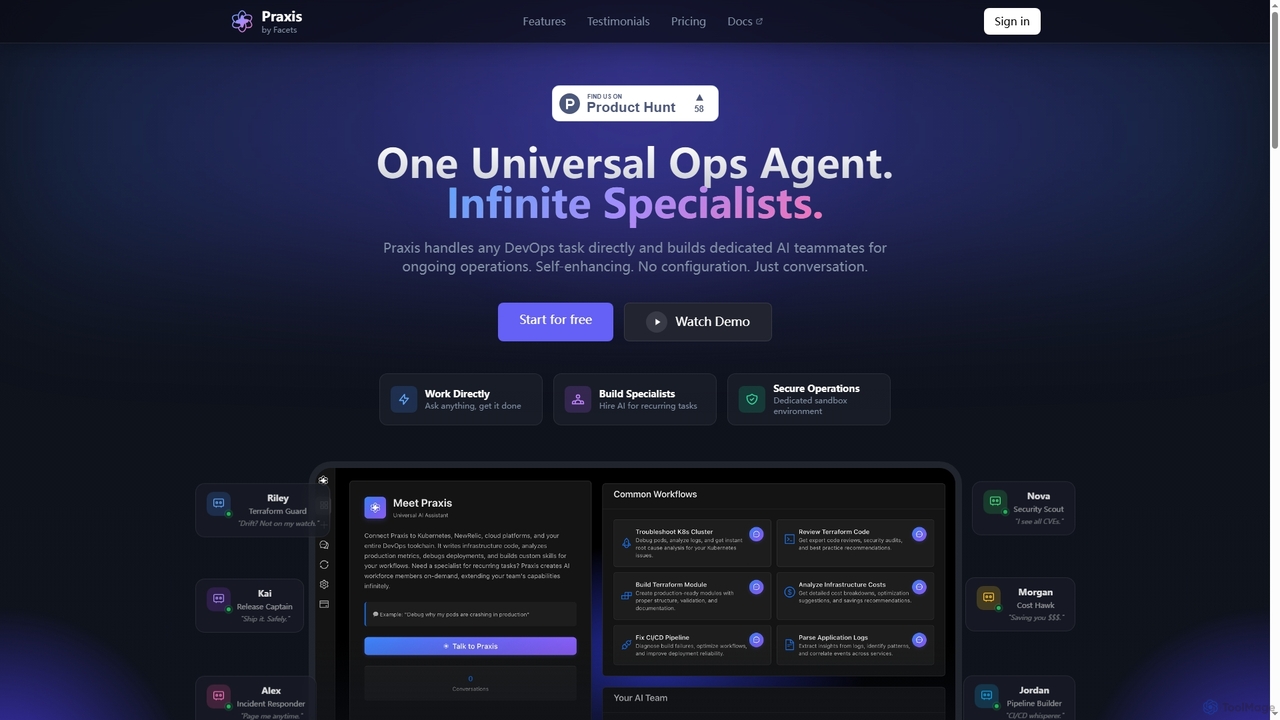
Popular Debugging AI tools in Code include BetterBugs, All Hands AI (OpenHands), papert, Roo Code, and Praxis, helping you work more efficiently.
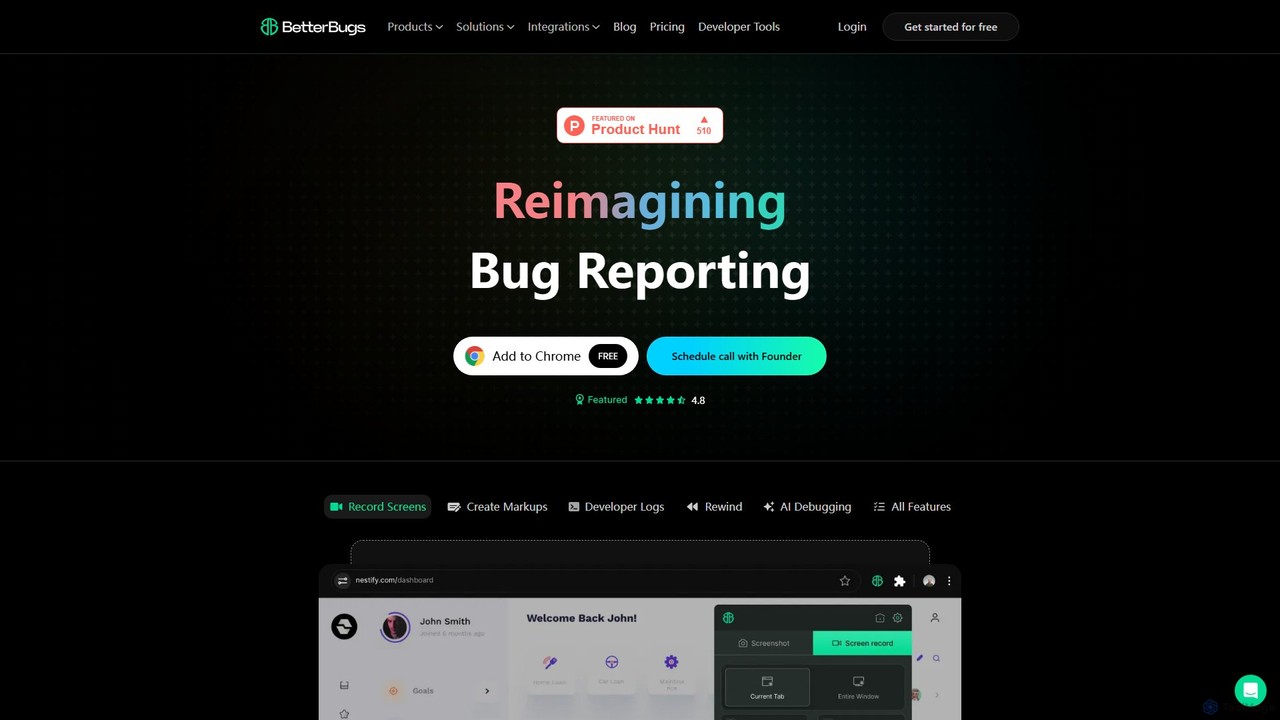
BetterBugs is an AI-powered bug reporting tool that helps development and QA teams capture precise, context-rich bug reports with a single click. It automatically includes screen recordings, annotations, and comprehensive developer logs (console logs, network requests) to streamline the debugging process and accelerate bug resolution.
Debugging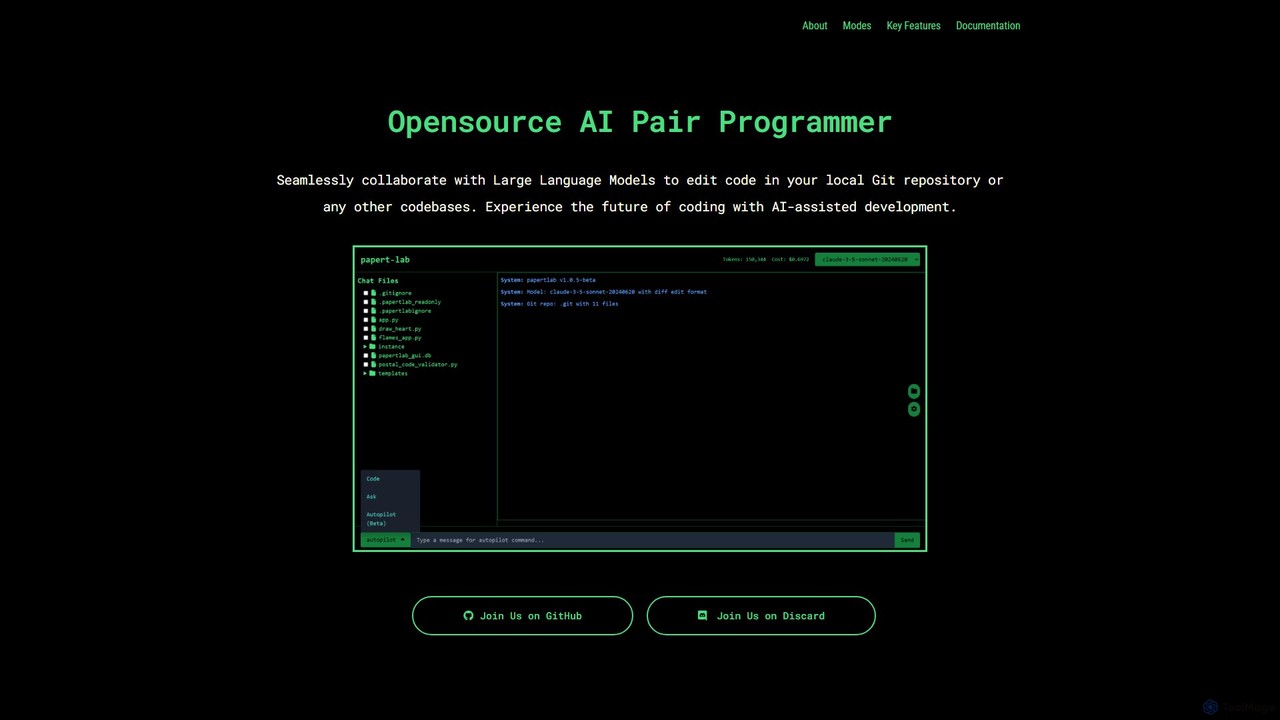
papert is an open-source AI pair programmer that integrates with your local Git repository. It allows developers to collaborate with LLMs like GPT-4o and Claude 3.5 Sonnet to ask questions, edit code across multiple files, refactor, debug, and automate routine coding tasks.
Debugging
All Hands AI (OpenHands) is a leading open-source AI coding agent designed to automate software development. It helps engineers with tasks like code reviews, refactoring, bug fixing, and test generation. Available as a flexible SaaS, self-hosted, or open-source solution, it integrates with tools like GitHub and GitLab to accelerate development cycles and improve code quality.
Code Generation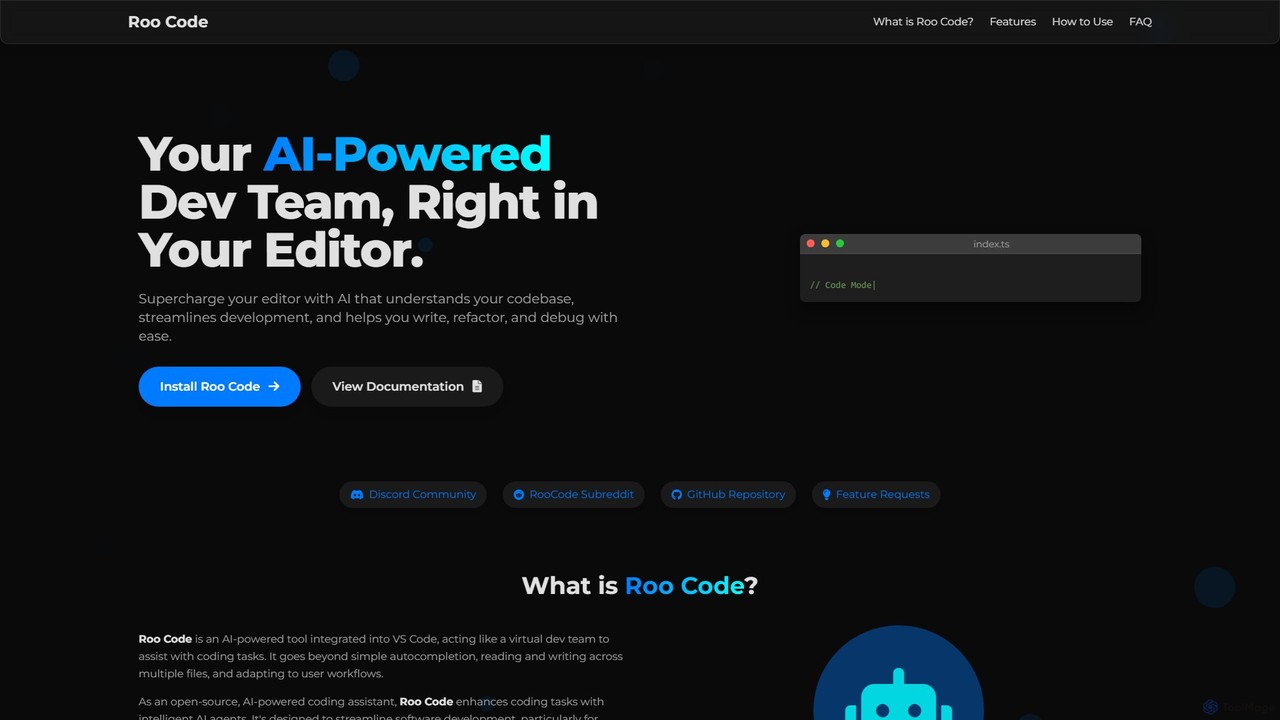
Roo Code is an open-source, AI-powered development assistant integrated directly into VS Code. It acts as a virtual dev team, understanding your entire codebase to help with complex coding, multi-file refactoring, and intelligent debugging, while supporting various AI models.
DebuggingAI Debugging tools are a specialized category of code assistants that use machine learning to automate and accelerate the process of finding and fixing software bugs. They analyze code, logs, and runtime data to intelligently pinpoint root causes and suggest potential solutions. This approach significantly reduces the manual effort required in traditional debugging, helping developers resolve complex issues more efficiently. By identifying patterns and anomalies that are difficult for humans to spot, these tools enhance code quality and stability.
These tools are particularly valuable in large-scale software development, especially for teams working on complex systems like microservices or cloud-native applications. They are frequently integrated into CI/CD pipelines to automate quality checks and are used by backend, mobile, and full-stack developers to diagnose and fix production issues faster.
When selecting an AI Debugging tool, consider its support for your programming languages and frameworks. Evaluate its integration capabilities with your existing IDE, version control, and CI/CD systems. Assess the accuracy and relevance of its bug detection and fix suggestions. Also, review the tool's data privacy and security policies, especially if it requires access to proprietary source code.
A mobile app developer receives a critical crash report from a user's device. Instead of manually parsing complex stack traces and device logs, they feed the report into an AI Debugging tool. The tool instantly analyzes the data, correlates it with the relevant source code, and pinpoints the exact line causing the crash. It further suggests a code snippet to handle the null pointer exception that was the root cause, reducing the diagnostic time from hours to minutes and enabling a rapid hotfix release.
A backend engineer is investigating an intermittent bug in a complex microservices architecture that only occurs under heavy load. Manually tracing requests across services is impractical. By using an AI Debugging tool integrated with their observability platform, the engineer can analyze distributed traces and logs from the time of the failure. The AI identifies a rare race condition between two services by detecting a specific pattern of log messages and latency spikes, a task that would be nearly impossible for a human to accomplish in a reasonable timeframe.
A DevOps team integrates an AI Debugging tool into their CI/CD pipeline. When a developer submits a pull request, the tool automatically scans the new code. It flags a potential memory leak in a newly added function by comparing its resource usage patterns against millions of open-source examples. The tool not only highlights the problematic code but also explains why it's a potential issue and suggests a more memory-efficient implementation. This prevents the bug from ever reaching the main branch, saving future debugging time and avoiding production incidents.
A junior developer is struggling to understand a complex piece of legacy code that is causing an error. Instead of interrupting a senior developer, they describe the error message and their goal in plain English to an AI Debugging assistant. The AI explains the function of the legacy code block, identifies the logical flaw based on the developer's description, and provides a corrected version of the code with comments explaining the changes. This not only solves the immediate problem but also serves as a powerful, on-demand learning tool for the junior developer.
A data engineer notices that a daily data processing job is taking longer to complete. They use an AI Debugging tool with profiling capabilities to analyze the application's performance during execution. The tool visualizes the entire call stack and highlights a specific database query as the primary bottleneck, consuming 80% of the execution time. It then suggests optimizing the query by adding a specific index to the database table. After applying the suggested change, the job's runtime is reduced by 75%, significantly improving system efficiency.
During a routine code review, a security engineer uses an AI-powered debugging and analysis tool to scan a new API endpoint. The tool identifies a subtle but critical SQL injection vulnerability that was missed by traditional static analysis tools. It explains how an attacker could exploit the vulnerability by providing a sample malicious payload. Furthermore, it generates a corrected, parameterized query that mitigates the risk entirely. This proactive security analysis helps the team patch vulnerabilities before they can be exploited in production.
AI Debugging tools are advanced software applications that use machine learning and artificial intelligence to help developers find, analyze, and fix bugs in their code more efficiently. Unlike traditional debuggers that require manual stepping through code, AI tools can automatically analyze logs, crash reports, and code patterns to pinpoint the root cause of an issue and often suggest a direct code fix. They act as intelligent assistants, accelerating the entire debugging workflow.
The primary difference lies in automation and intelligence. Traditional debuggers (like GDB or those in IDEs) are manual tools; you set breakpoints, step through code, and inspect variables yourself. AI Debugging tools automate this analysis. They can:
Choosing the right tool depends on your specific needs. Consider these factors:
No, AI Debugging tools are designed to augment, not replace, human developers. They excel at automating repetitive, data-intensive tasks like log analysis and pattern recognition, freeing up developers to focus on more complex, creative problem-solving. A developer's domain knowledge, understanding of business logic, and critical thinking are still essential for interpreting the AI's suggestions and making final decisions. These tools are best viewed as powerful collaborators that significantly boost a developer's productivity and effectiveness.
Security is a critical consideration. Reputable AI Debugging tools address this in several ways. Many tools can analyze code locally on your machine or within your private cloud, ensuring your source code never leaves your control. For cloud-based services, they typically use end-to-end encryption and have strict data privacy policies, often complying with standards like SOC 2 or GDPR. Always review a tool's security documentation and privacy policy before use, and prefer tools that offer on-premise or VPC (Virtual Private Cloud) deployment options for maximum security.