ToolMage
Sign in

Best 3 Observability AI tools for Data

Popular Observability AI tools in Data include Metaplane, Trackingplan, and Elementary Data, helping you work more efficiently.

Trackingplan
Freemium

Trackingplan

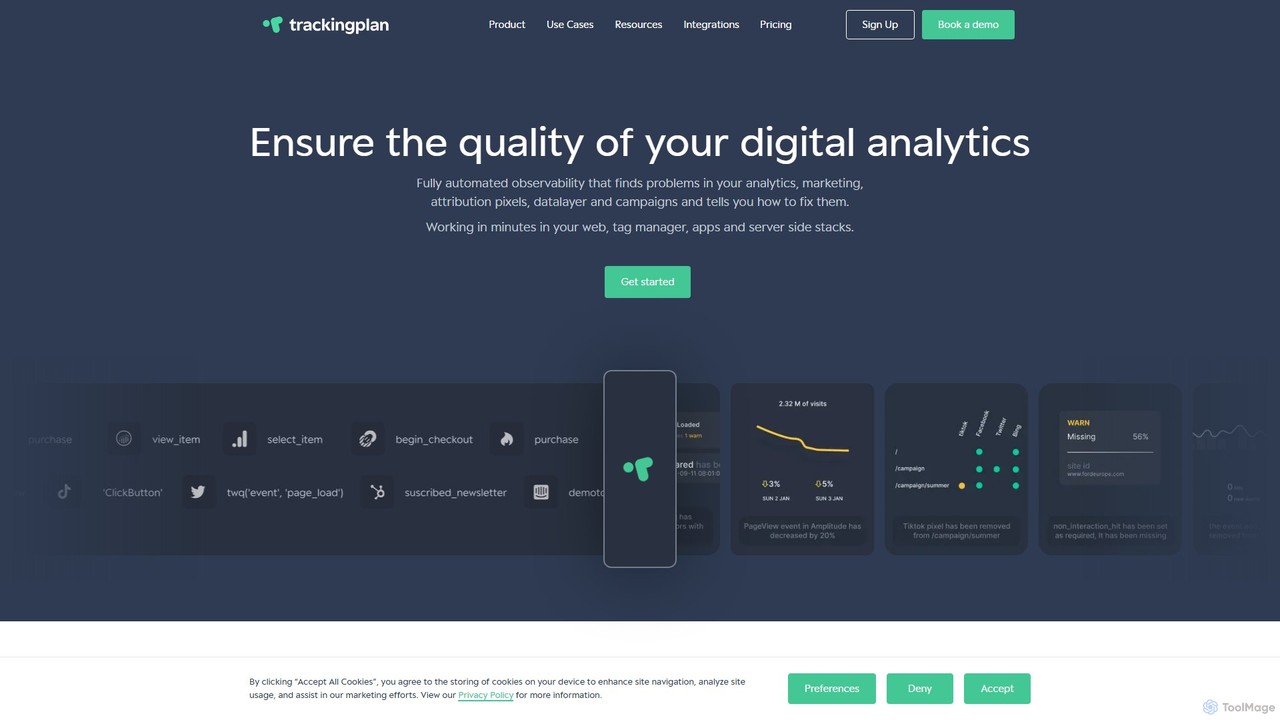
Trackingplan is an automated data observability platform that ensures the quality of your digital analytics. It proactively detects and helps fix errors in your analytics implementations, marketing pixels, and campaign tracking in real-time. By eliminating manual audits, it saves time and ensures data integrity for data-driven decisions.

Observability
Visits 25.5KFavorites 135Likes 126
Elementary Data
Freemium

Elementary Data

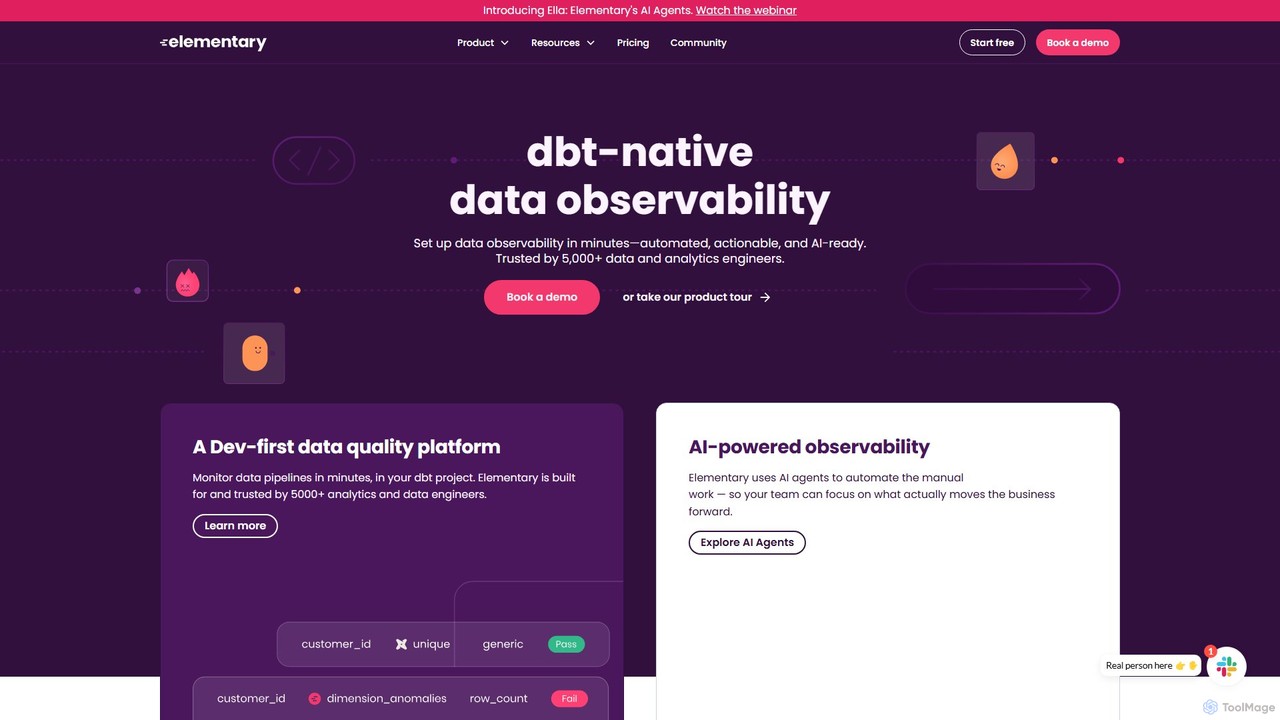
Elementary Data is a dbt-native data observability platform designed for data and analytics engineers. It uses AI agents to automate data quality monitoring, detect anomalies, and provide end-to-end lineage. The platform helps teams reduce alert noise, resolve incidents faster, and build trust in their data for AI and analytics applications.

Observability
Visits 19.9KFavorites 99Likes 118
Metaplane
Freemium

Metaplane

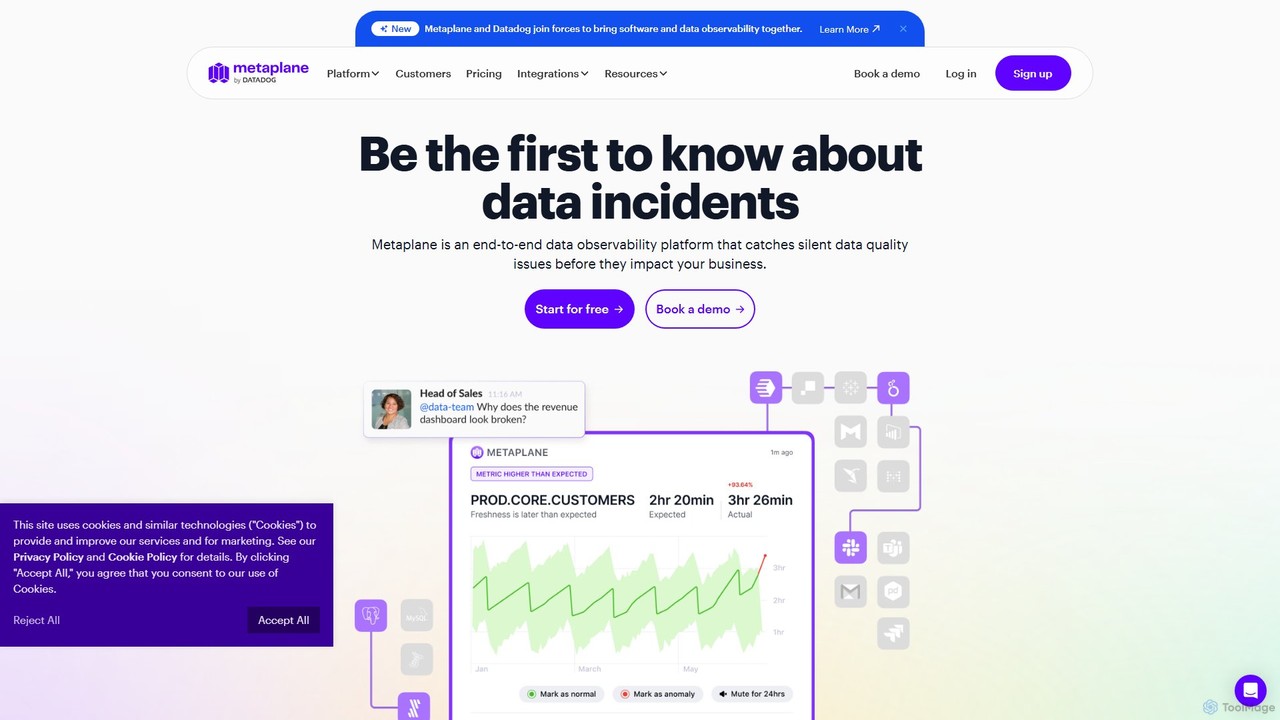
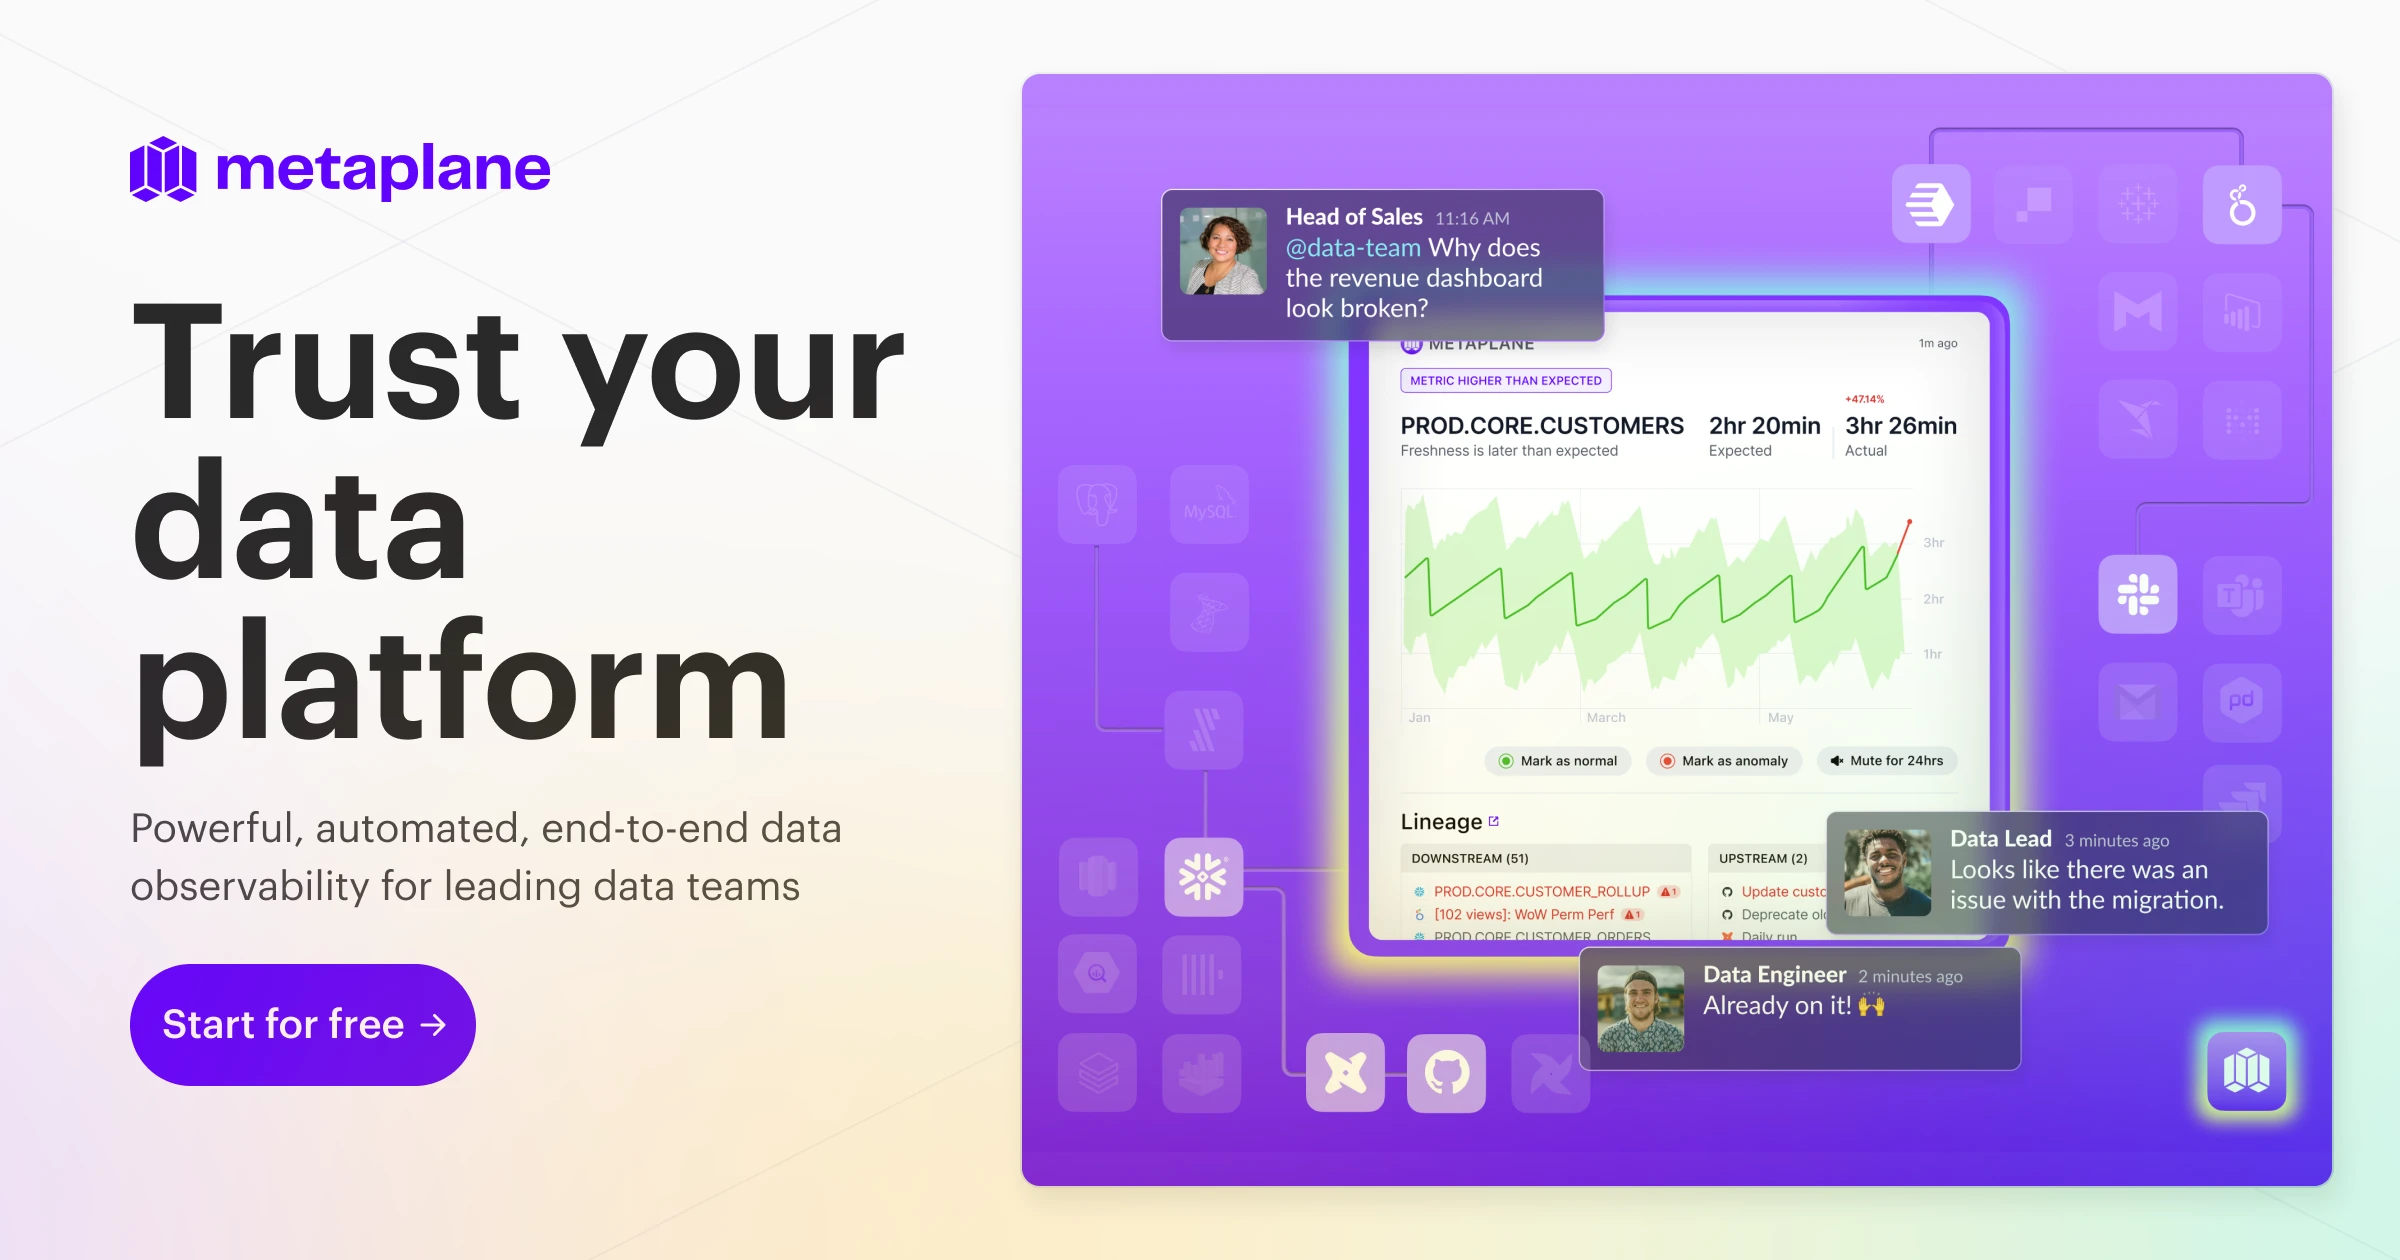
Metaplane is an end-to-end data observability platform for modern data teams. It uses machine learning to automatically monitor your data stack, detect silent data quality issues before they impact the business, and provide actionable alerts with full context.

Analytics
Visits 30.5KFavorites 97Likes 111

About Observability

AI Observability tools are platforms that use machine learning to analyze and interpret the vast amounts of data generated by complex IT systems. They process the three pillars of observability—metrics, logs, and traces—to automatically detect anomalies, predict failures, and identify root causes without manual intervention. This proactive approach helps teams understand the internal state of their systems, moving beyond simple monitoring to provide deep, actionable insights. These tools are essential for maintaining the reliability and performance of modern, distributed applications.

Core Features

  • Automated Anomaly Detection: Uses AI to identify unusual patterns and deviations from normal behavior in real-time system data.
  • AI-Powered Root Cause Analysis (RCA): Correlates disparate signals across metrics, logs, and traces to pinpoint the source of an issue quickly.
  • Predictive Insights & Forecasting: Leverages historical data to forecast future trends, potential bottlenecks, and system failures before they impact users.
  • Intelligent Log Clustering: Automatically groups similar, unstructured log messages into patterns, reducing noise and highlighting critical events.
  • Distributed Tracing Visualization: Maps the entire journey of user requests across multiple microservices to identify performance bottlenecks.

Use Cases

These tools are primarily used by Site Reliability Engineers (SREs), DevOps teams, and platform engineers responsible for managing cloud-native applications, microservices architectures, and Kubernetes environments. They are critical in industries like e-commerce, finance, and SaaS, where system uptime and performance directly impact business outcomes.

How to Choose

When selecting an AI Observability tool, consider its compatibility with your existing technology stack (e.g., OpenTelemetry support), its ability to scale and handle high volumes of data, and the sophistication of its AI models for reducing alert fatigue. Also evaluate the clarity of its data visualizations, the ease of querying, and a pricing model that aligns with your data ingestion and retention needs.

Featured tool rankings

Observability use cases

1

Proactive Microservice Failure Detection

An SRE team for an e-commerce platform uses an AI observability tool to monitor hundreds of microservices. The tool's AI model, trained on baseline performance data, detects a subtle increase in latency for the payment processing service. It automatically correlates this with a spike in database query time and an unusual error log pattern from a related inventory service. The system generates a single, context-rich alert, allowing the team to investigate and resolve the underlying database issue before it causes widespread checkout failures, thus preventing revenue loss and protecting user experience.

2

Automating Root Cause Analysis for Incidents

During a production incident, a DevOps engineer receives an alert for a critical application error. Instead of manually searching through logs from dozens of services, they turn to the AI observability platform. The tool's RCA feature has already analyzed the distributed traces and log patterns leading up to the incident. It presents a clear timeline highlighting a recent configuration change in a downstream API as the most likely root cause, along with evidence from correlated error logs. This reduces the Mean Time To Resolution (MTTR) from hours to minutes, minimizing service disruption.

3

Optimizing Cloud Resource Allocation

A platform engineering team manages a large Kubernetes cluster on a public cloud. By feeding resource utilization metrics (CPU, memory) into an AI observability tool, they gain insights beyond simple averages. The AI model identifies services that are consistently over-provisioned, even during peak hours, and predicts future usage patterns based on historical trends. Using these recommendations, the team confidently adjusts resource requests and autoscaling policies, leading to a significant reduction in their monthly cloud bill without compromising application performance.

4

Improving User Experience with Performance Monitoring

A product team for a SaaS application uses an AI observability tool to monitor end-user experience. The tool's distributed tracing capabilities capture the full lifecycle of user requests, from a button click in the browser to database queries and back. When users report slow dashboard loading times, the team can immediately visualize the corresponding traces. The tool highlights that a specific third-party API call is the bottleneck. This allows developers to implement caching or optimize the integration, directly improving user satisfaction and retention.

5

Security Threat Detection through Log Analysis

A SecOps team integrates security logs from firewalls, applications, and operating systems into their AI observability platform. The tool's intelligent log clustering and anomaly detection capabilities go beyond simple rule-based alerts. It identifies a novel, slow-moving brute-force attack by flagging a statistically significant increase in failed login attempts from a distributed set of IP addresses over several hours. This pattern would be missed by traditional systems, allowing the team to proactively block the malicious IPs and prevent a security breach.

6

Capacity Planning and Business Trend Forecasting

A financial services company uses its AI observability tool not just for technical monitoring, but for business intelligence. By correlating application performance metrics with business transaction data (e.g., trades per second), the AI model learns seasonal patterns. It accurately forecasts a 30% surge in traffic for the upcoming end-of-quarter reporting period. This enables the infrastructure team to proactively scale up resources, ensuring the platform remains fast and responsive during a critical business cycle, preventing performance degradation that could impact financial operations.

Observability FAQ

What are AI Observability tools?

AI Observability tools are advanced platforms that apply artificial intelligence and machine learning to system-generated data, including metrics, logs, and traces. Unlike traditional monitoring that tracks known failure modes, these tools aim to understand the overall health and behavior of a complex system. They automatically detect unknown anomalies, correlate events to find root causes, and predict potential issues, enabling teams to proactively manage system reliability and performance.

How does AI observability differ from traditional monitoring?

Traditional monitoring focuses on tracking pre-defined metrics and thresholds (e.g., 'is CPU usage above 90%?'). It tells you *that* a problem exists. AI observability, on the other hand, is about asking questions of your system to understand *why* a problem is happening. It uses AI to analyze all available data (logs, metrics, traces) to uncover unknown issues, identify complex patterns, and provide context-rich insights for faster troubleshooting in dynamic environments like microservices.

What are the three pillars of observability?

The three pillars of observability provide a framework for understanding system behavior. They are:

  • Metrics: Numerical, time-series data representing system health or performance (e.g., CPU utilization, request latency). They are useful for aggregation and alerting on known conditions.
  • Logs: Timestamped, immutable records of discrete events. They provide detailed, context-rich information about what happened at a specific point in time.
  • Traces: A representation of the end-to-end journey of a single request as it moves through multiple services in a distributed system. They are crucial for debugging performance bottlenecks.

AI observability tools excel at correlating data across all three pillars to provide a unified view.

Who should use AI Observability tools?

AI Observability tools are most beneficial for technical teams managing complex, distributed, and dynamic systems. Key users include:

  • Site Reliability Engineers (SREs): For proactively maintaining system reliability, managing SLOs, and reducing incident response times.
  • DevOps Teams: To gain visibility into the entire software development lifecycle, from deployment to production performance.
  • Platform Engineers: For optimizing and managing the underlying infrastructure, such as Kubernetes clusters and cloud services.
  • Software Developers: To understand how their code behaves in production and to debug performance issues more effectively.
How do I choose the right AI Observability tool?

Choosing the right tool depends on your specific needs. Consider these factors:

  • Data Source Compatibility: Does it support your technology stack? Look for broad integration capabilities, especially support for open standards like OpenTelemetry.
  • Scalability: Can the platform handle your current and future data volume without performance degradation or excessive cost?
  • AI/ML Capabilities: Evaluate the sophistication of its anomaly detection, root cause analysis, and predictive features. Does it effectively reduce alert noise?
  • Usability and Visualization: Is the interface intuitive? Does it provide clear, actionable dashboards and easy ways to query and explore data?
  • Pricing Model: Understand the pricing structure (e.g., per host, per GB ingested, per user) and how it aligns with your budget and usage patterns.