
ToolMage
Sign in

Best 1 Automated Reporting AI tools for Productivity

Popular Automated Reporting AI tools in Productivity include Capitol, helping you work more efficiently.

Capitol

Capitol

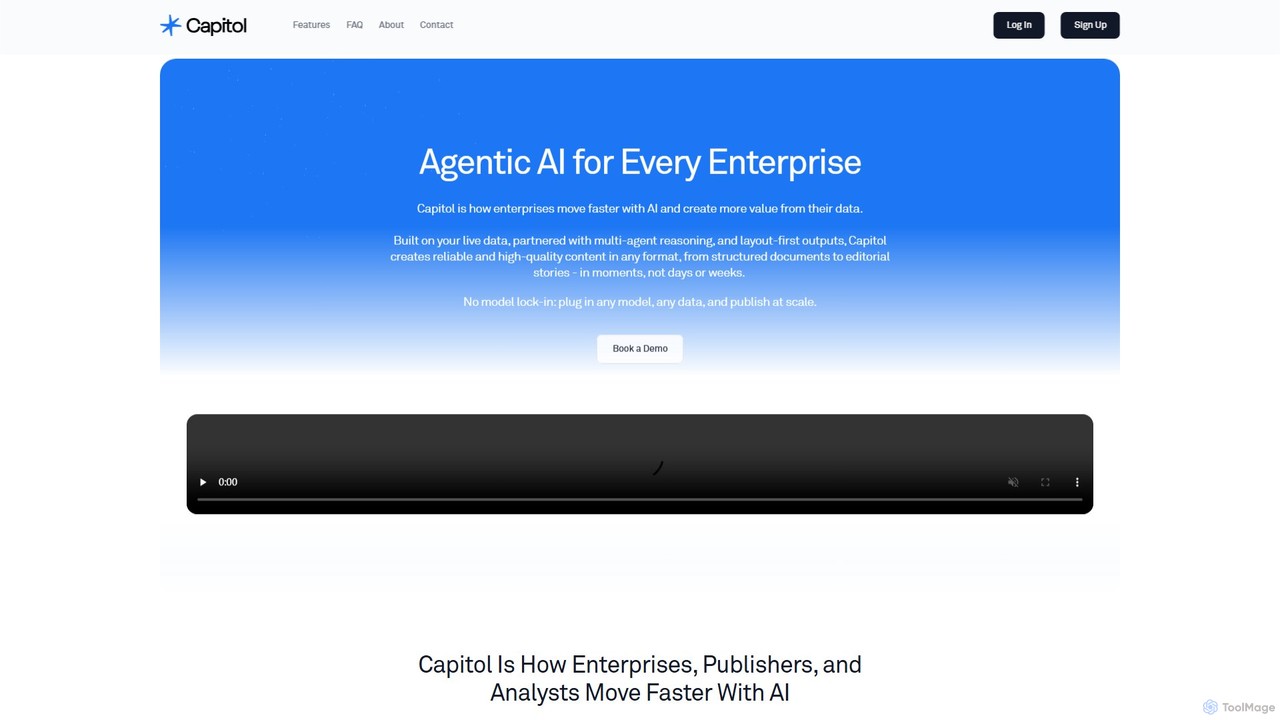
Capitol is an agentic AI platform for enterprises, designed to transform live data into high-quality, structured content and reports. It leverages multi-agent reasoning to automate content creation, offering model-agnostic flexibility, robust security, and seamless data integration. Ideal for data teams, financial services, publishers, and government agencies seeking to accelerate insights and content workflows.

Content Generation
Visits 26.5KFavorites 138Likes 150

About Automated Reporting

Automated Reporting tools are AI-powered solutions designed to streamline the entire report generation process, from data collection to final presentation. These tools leverage advanced algorithms to automatically gather, analyze, and visualize data from various sources, transforming raw information into actionable insights. By automating repetitive tasks, they significantly enhance efficiency and enable data-driven decision-making across organizations, contributing directly to overall productivity.

Core Features

  • Automated Data Integration: Connects seamlessly with diverse data sources (CRM, ERP, marketing platforms) to pull real-time information.
  • Intelligent Data Analysis: Utilizes AI to identify trends, anomalies, and key performance indicators (KPIs) within complex datasets.
  • Customizable Report Templates: Offers flexible templates and drag-and-drop interfaces for creating tailored reports and dashboards.
  • Scheduled Report Delivery: Automatically generates and distributes reports to stakeholders at predefined intervals.
  • Interactive Dashboards: Provides dynamic, visual summaries of data, allowing users to drill down into specific metrics.

Applicable Scenarios

Marketing teams use automated reporting to track campaign performance, analyze customer behavior, and optimize ad spend without manual data compilation. Financial departments leverage these tools for generating monthly budget reports, expense analyses, and compliance documentation, ensuring accuracy and saving countless hours. Sales managers benefit from real-time sales performance dashboards, enabling quick identification of top performers and areas needing improvement.

How to Choose

When selecting an automated reporting tool, consider its data source compatibility to ensure it integrates with your existing systems. Evaluate the customization options for reports and dashboards to match your specific analytical needs. Assess the scalability and performance to handle growing data volumes and user demands. Finally, review the security features and compliance standards to protect sensitive business information.

Automated Reporting use cases

1

Automating Monthly Financial Performance Reviews

Financial analysts and controllers can use automated reporting tools to consolidate data from various accounting systems, ERPs, and spreadsheets. The tool automatically generates comprehensive monthly financial statements, budget vs. actual reports, and cash flow analyses. This eliminates manual data entry and reconciliation, ensuring accuracy and freeing up significant time for strategic financial planning and forecasting.

2

Real-time Marketing Campaign Performance Tracking

Marketing managers can connect their advertising platforms (Google Ads, Facebook Ads), CRM, and analytics tools to an automated reporting system. The system continuously pulls data, generating real-time dashboards that display key metrics like ROI, conversion rates, and customer acquisition costs. This allows for immediate campaign adjustments, optimizing spend and improving overall marketing effectiveness without daily manual data compilation.

3

Streamlining Sales Performance and Pipeline Reporting

Sales directors and team leads utilize automated reporting to aggregate sales data from CRM systems. The tool automatically creates daily, weekly, or monthly reports on individual salesperson performance, regional sales figures, and pipeline health. This provides clear visibility into sales trends, identifies bottlenecks, and supports proactive coaching, leading to more efficient sales operations and improved revenue generation.

4

Generating Operational Efficiency Reports for Production

Operations managers in manufacturing or logistics can integrate data from IoT sensors, production systems, and supply chain software. Automated reporting tools then generate reports on machine uptime, production output, defect rates, and inventory levels. This enables rapid identification of operational inefficiencies, facilitates predictive maintenance, and supports data-driven decisions to optimize resource allocation and reduce costs.

5

Automated Customer Service Metrics and Trend Analysis

Customer service managers can link their ticketing systems, call center software, and customer feedback platforms. The automated reporting system compiles data on response times, resolution rates, customer satisfaction scores (CSAT), and common issue categories. This provides insights into service quality, helps identify training needs for agents, and highlights recurring customer pain points for product improvement.

6

Compliance and Regulatory Reporting Automation

Compliance officers and legal teams in regulated industries can leverage automated reporting to collect and structure data required for various regulatory submissions. The tool ensures data integrity and consistency, automatically generating reports that meet specific legal and industry standards. This drastically reduces the risk of human error, streamlines audit processes, and ensures timely adherence to complex compliance requirements.

Automated Reporting FAQ

What are Automated Reporting tools?

Automated Reporting tools are AI-powered software solutions that automatically collect, process, analyze, and present data from various sources into structured reports and interactive dashboards. They are designed to eliminate manual data compilation and report generation, providing businesses with timely, accurate, and actionable insights for decision-making. These tools significantly enhance productivity by freeing up human resources from repetitive data tasks.

How do Automated Reporting tools differ from traditional BI dashboards?

While both provide data visualization, Automated Reporting tools go beyond traditional Business Intelligence (BI) dashboards by actively automating the entire report creation and distribution process. Traditional BI dashboards often require manual setup and data refreshing, whereas automated tools can autonomously pull data, apply predefined analyses, generate full reports (not just visuals), and even schedule their delivery to stakeholders. They focus on proactive report generation rather than just reactive data exploration.

What are the key benefits of using Automated Reporting tools?

The primary benefits include significant time savings by eliminating manual data tasks, improved data accuracy due to reduced human error, and access to real-time insights for faster decision-making. They also enhance consistency in reporting across departments, allow for greater customization of report formats, and free up employees to focus on more strategic, value-added activities. Ultimately, they drive operational efficiency and better business outcomes.

What types of data sources can Automated Reporting tools integrate with?

Automated Reporting tools are typically designed to integrate with a wide array of data sources. This includes common business applications like CRM (e.g., Salesforce), ERP (e.g., SAP), marketing automation platforms (e.g., HubSpot), and financial software (e.g., QuickBooks). They can also connect to databases (SQL, NoSQL), cloud storage (Google Drive, Dropbox), web analytics platforms (Google Analytics), social media APIs, and even custom APIs for proprietary systems.

How can Automated Reporting improve productivity within an organization?

Automated Reporting dramatically boosts productivity by transforming time-consuming, manual data tasks into efficient, automated processes. Employees who previously spent hours or days compiling data and formatting reports can now dedicate that time to analysis, strategy development, and execution. This shift allows teams to focus on higher-value activities, make quicker, more informed decisions based on fresh data, and ultimately achieve more with existing resources, driving overall organizational efficiency.