ToolMage
Sign in
Dynatrace
Analytics · 1.4M monthly visits

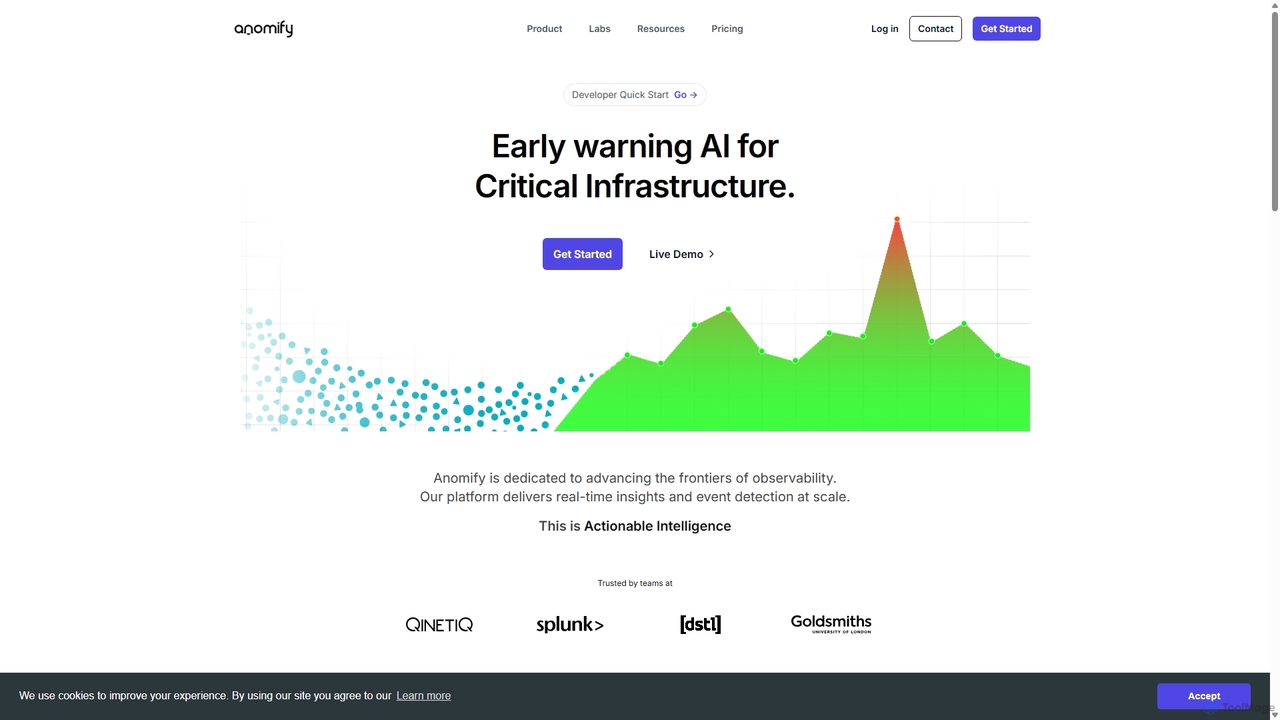
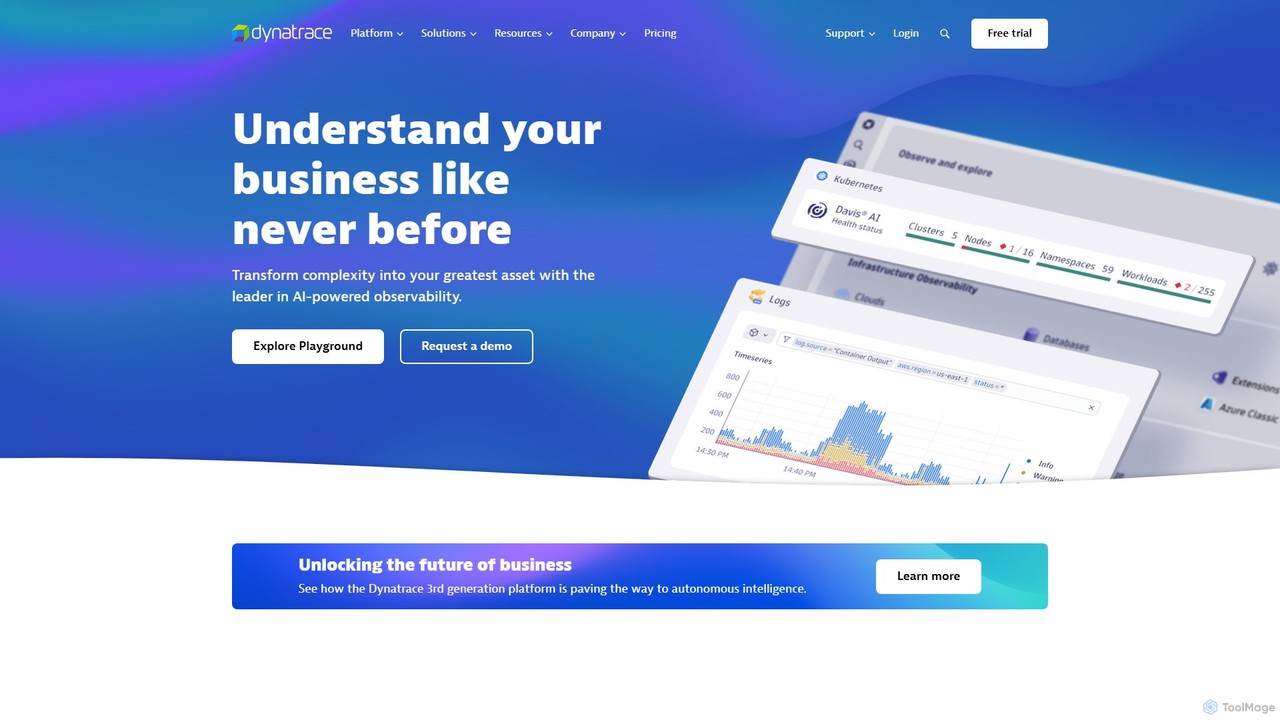
Dynatrace is an all-in-one, AI-powered observability and security platform. It provides intelligent automation and precise answers about the performance of applications, the underlying infrastructure, and the experience of all users, enabling organizations to innovate faster, collaborate more efficiently, and deliver better business outcomes.
VS
Middleware
Observability · 46.5K monthly visits

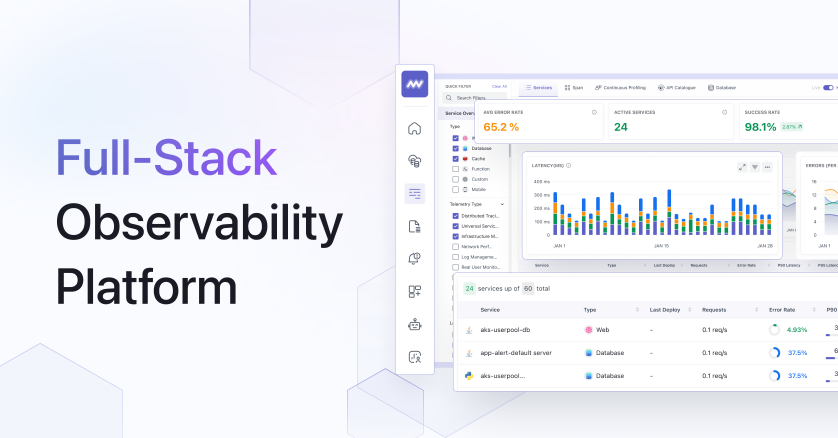
Middleware is an AI-powered, full-stack cloud observability platform designed to modernize IT infrastructure. It unifies logs, metrics, traces, and RUM data into a single view, enabling teams to monitor their entire tech stack in real-time. With its core OpsAI feature, Middleware automatically detects, diagnoses, and even resolves up to 70% of issues, significantly reducing resolution time and improving developer productivity. It offers a cost-effective, scalable solution for businesses of all sizes.

Dynatrace vs Middleware: pricing, features, traffic, and use cases

Compare Dynatrace and Middleware across positioning, pricing, traffic, and user feedback using structured factual data.

Updated Aug 21, 2026

Product overview

Dynatrace Product overview

Dynatrace is an all-in-one, AI-powered observability and security platform. It provides intelligent automation and precise answers about the performance of applications, the underlying infrastructure, and the experience of all users, enabling organizations to innovate faster, collaborate more efficiently, and deliver better business outcomes.
Preview

Middleware Product overview

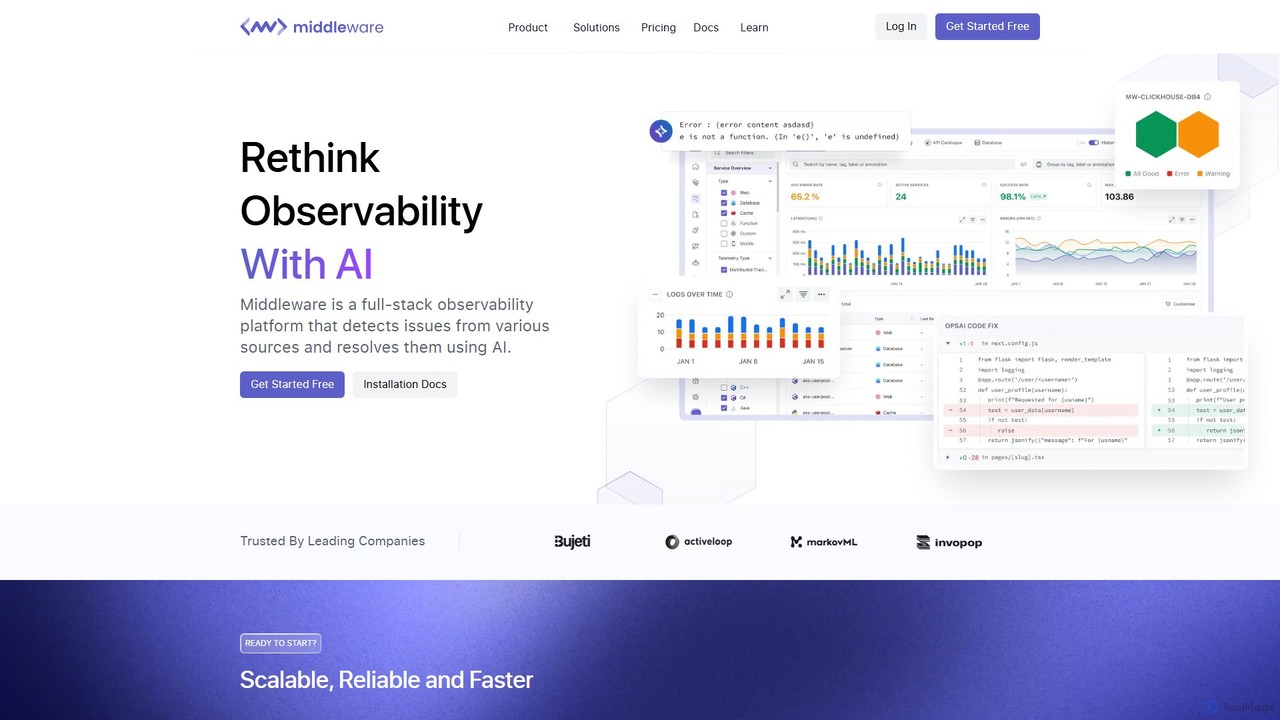
Middleware is an AI-powered, full-stack cloud observability platform designed to modernize IT infrastructure. It unifies logs, metrics, traces, and RUM data into a single view, enabling teams to monitor their entire tech stack in real-time. With its core OpsAI feature, Middleware automatically detects, diagnoses, and even resolves up to 70% of issues, significantly reducing resolution time and improving developer productivity. It offers a cost-effective, scalable solution for businesses of all sizes.

Preview

Detailed feature comparison

FeatureDynatraceMiddleware
Primary categoryAnalyticsObservability
Added2025-08-082025-08-17
PricingFreemiumFreemium
Official websitewww.dynatrace.commiddleware.io
Product typeWebsiteWebsite
Performance data
User ratingNot verifiedNot verified
Comments00
Monthly visits1.4M46.5K
Monthly growth-7.5%-13.2%
Favorites121119
DetailsView detailsView details

Dynatrace vs Middleware monthly traffic

Compare Dynatrace and Middleware by monthly reach, traffic trend, visit depth, top regions, and acquisition sources.

How to interpret the traffic data

In the Dynatrace vs Middleware monthly traffic comparison, Dynatrace currently shows 1.4M visits and Middleware shows 46.5K; Dynatrace has about 29.2 times the visible traffic of Middleware, an absolute difference of about 1.3M visits. This reflects visible reach, not feature quality or paid users.

Both tools provide verified traffic details, so monthly trends, visit depth, regions, and acquisition sources can be compared on the same basis.

Dynatrace monthly traffic:

Latest traffic

Monthly visits
1.4M
Avg. visit duration
11:52
Pages per visit
13.24
Bounce rate
26.64%
Data updated 2026-06-15

Monthly traffic trend

  • 2025/9: 1.3M Monthly visits
  • 2026/1: 1.3M Monthly visits
  • 2026/2: 1.3M Monthly visits
  • 2026/3: 1.5M Monthly visits
  • 2026/4: 1.5M Monthly visits
  • 2026/5: 1.4M Monthly visits

Top regions

Top 5 countries/regions
Country/regionPercentageTraffic
🇺🇸United States61.68%837.9K
🇮🇳India12.68%172.3K
🇦🇷Argentina10.08%136.9K
🇮🇹Italy10.05%136.5K
🇨🇦Canada5.51%74.9K

Traffic sources

Source typePercentageTraffic
Direct76.66%1M
Referral18.96%257.6K
Email4.38%59.5K

Search keywords

devopsdynatracedynatrace careersdynatrace hubopentelemetry

Middleware monthly traffic:

Latest traffic

Monthly visits
46.5K
Avg. visit duration
0:22
Pages per visit
2.07
Bounce rate
39.02%
Data updated 2026-06-15

Monthly traffic trend

  • 2025/9: 87K Monthly visits
  • 2026/1: 122K Monthly visits
  • 2026/2: 82.5K Monthly visits
  • 2026/3: 65.8K Monthly visits
  • 2026/4: 53.6K Monthly visits
  • 2026/5: 46.5K Monthly visits

Top regions

Top 5 countries/regions
Country/regionPercentageTraffic
🇮🇳India38.73%18K
🇺🇸United States25.22%11.7K
🇳🇬Nigeria16.65%7.7K
🇷🇺Russia9.87%4.6K
🇩🇪Germany9.53%4.4K

Traffic sources

Source typePercentageTraffic
Direct94.79%44.1K
Email3.99%1.9K
Referral1.22%567

Search keywords

distributed trace complete guide bloghow to prune volumes in dockerlogging.formatter example jsonmiddlewareprometheus labe lvalue matcing
Traffic-based selection guidance: If public market visibility is an important first-pass criterion, investigate Dynatrace first. The final choice should still follow taxonomy, use case, and a real trial because higher traffic does not prove broader capabilities or better workflow fit.

Usage comparison

Compare the core capabilities of Dynatrace and Middleware

Dynatrace Core features

Monitoring
Analytics
Performance Testing

Middleware Core features

Monitoring
Observability
Cloud Management

Use cases

Dynatrace Use cases

APM
cloud monitoring
devops
infrastructure monitoring
log management
observability
AIOps
application security
digital experience
sre

Middleware Use cases

APM
cloud monitoring
devops
infrastructure monitoring
log management
observability
AI for developers
Datadog alternative
error tracking
performance monitoring
site reliability

Dynatrace vs Middleware:In-depth comparison and selection guidance

First decide whether the products solve the same kind of need

This in-depth Dynatrace vs Middleware comparison uses only the product records, taxonomy, audience, traffic, and community signals available on this page. Dynatrace is primarily listed under “Analytics”, while Middleware is primarily listed under “Observability”, so the first decision is whether your actual task matches their recorded scope.

The structured fields currently show these decision-relevant differences: Primary category (Dynatrace: Analytics; Middleware: Observability); Monthly visits (Dynatrace: 1.4M; Middleware: 46.5K); Monthly growth (Dynatrace: -7.5%; Middleware: -13.2%); Favorites (Dynatrace: 121; Middleware: 119); Website (Dynatrace: www.dynatrace.com; Middleware: middleware.io). These facts are more useful for selection than brand visibility alone.

What market visibility and monthly traffic mean

In the Dynatrace vs Middleware monthly traffic comparison, Dynatrace currently shows 1.4M visits and Middleware shows 46.5K; Dynatrace has about 29.2 times the visible traffic of Middleware, an absolute difference of about 1.3M visits. This reflects visible reach, not feature quality or paid users.

Both tools provide verified traffic details, so monthly trends, visit depth, regions, and acquisition sources can be compared on the same basis.

If public market visibility is an important first-pass criterion, investigate Dynatrace first. The final choice should still follow taxonomy, use case, and a real trial because higher traffic does not prove broader capabilities or better workflow fit.

Product positioning, use cases, and roles

Dynatrace and Middleware currently overlap in shared categories: Monitoring; shared tags: APM, cloud monitoring, devops, infrastructure monitoring, log management, and observability. This can place both on the same shortlist, but it does not prove equal implementation, depth, or cost.

Dynatrace's unique categories/tags are Analytics, Performance Testing, AIOps, application security, digital experience, and sre; Middleware's are Observability, Cloud Management, AI for developers, Datadog alternative, error tracking, performance monitoring, and site reliability. These unique fields are the strongest differentiators: validate the product whose recorded scope matches the task instead of following traffic alone.

What ratings, comments, and favorites can tell you

Dynatrace has no verified rating, 0 comments, 121 favorites, and 131 likes;Middleware has no verified rating, 0 comments, 119 favorites, and 108 likes。

Neither product has enough rating or comment samples for a credible reputation ranking.

Selection guidance by actual need

When to evaluate Dynatrace first

Put Dynatrace on the priority trial list when the task aligns with “Analytics” and especially Analytics, Performance Testing, AIOps, application security, digital experience, and sre. This follows recorded positioning and does not imply unlisted capabilities are absent.

Dynatrace also currently records: pricing is freemium, product type is website, 1.4M verified monthly visits, no verified user rating. Verify any hard requirement around price, platform, or reach before trial, and do not let sparse review data substitute for testing.

When to evaluate Middleware first

Put Middleware on the priority trial list when the task aligns with “Observability” and especially Observability, Cloud Management, AI for developers, Datadog alternative, error tracking, and performance monitoring. This follows recorded positioning and does not imply unlisted capabilities are absent.

Middleware also currently records: pricing is freemium, product type is website, 46.5K verified monthly visits, no verified user rating. Verify any hard requirement around price, platform, or reach before trial, and do not let sparse review data substitute for testing.

How to validate the recommendation before deciding

The available data describes positioning, public visibility, and community signals, but it cannot prove output quality, speed, integration effort, privacy, or long-term cost in your workflow. Before deciding, run the same representative tasks in Dynatrace and Middleware, then record completion time, accuracy, manual corrections, and the real paid threshold. A like-for-like trial turns this comparison into a defensible adoption decision.

Comparison FAQ

How should I choose between Dynatrace and Middleware?
Compare positioning, pricing, taxonomy, and traffic maturity, then verify the latest details on each official website.
Where does this comparison data come from?
The factual baseline is derived from product, taxonomy, traffic, and community data. Reviewed editorial conclusions show their source and verification date.
What do unknown fields mean?
Unknown means there is not enough reliable evidence; the page does not fill gaps with assumptions.

Related AI tools

New Relic
Freemium

New Relic

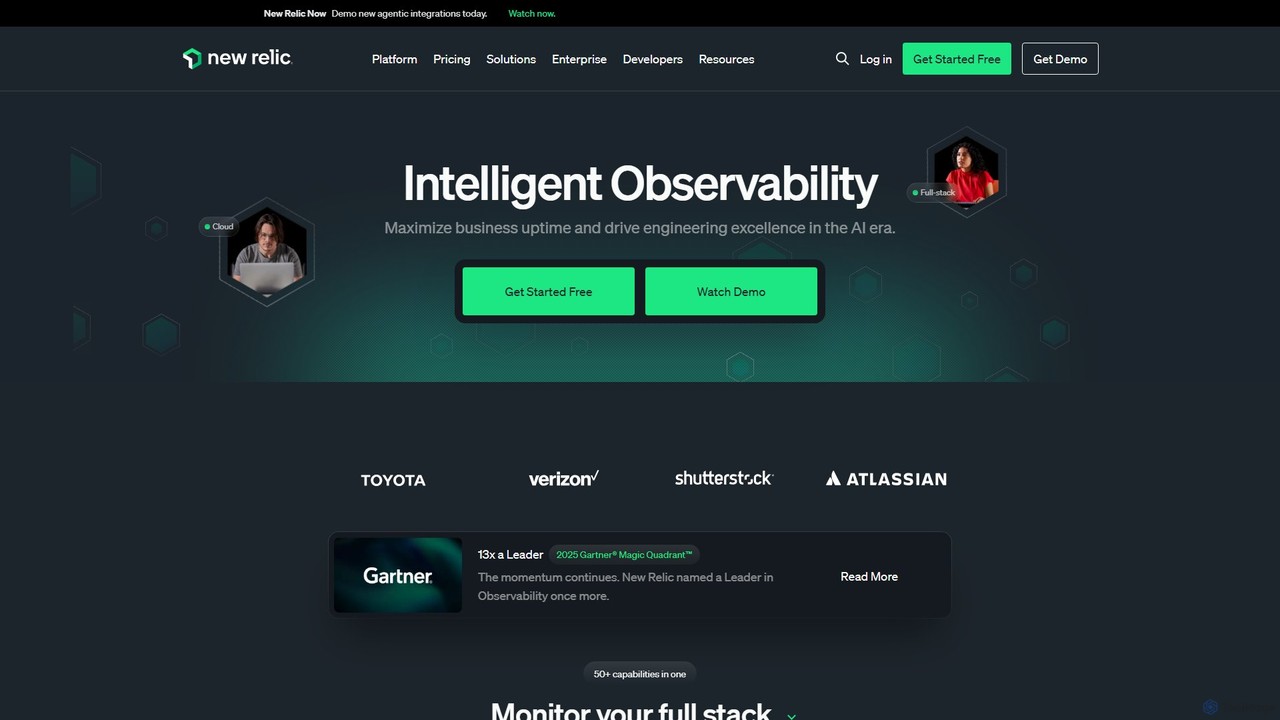
New Relic is an AI-powered, full-stack observability platform that helps engineering teams monitor, debug, and improve their entire software stack. It provides a unified view of all telemetry data—metrics, events, logs, and traces—to enable faster problem resolution and optimized performance in the AI era.

Infrastructure
Visits 1.3MFavorites 120Likes 116
Site24x7
Freemium

Site24x7

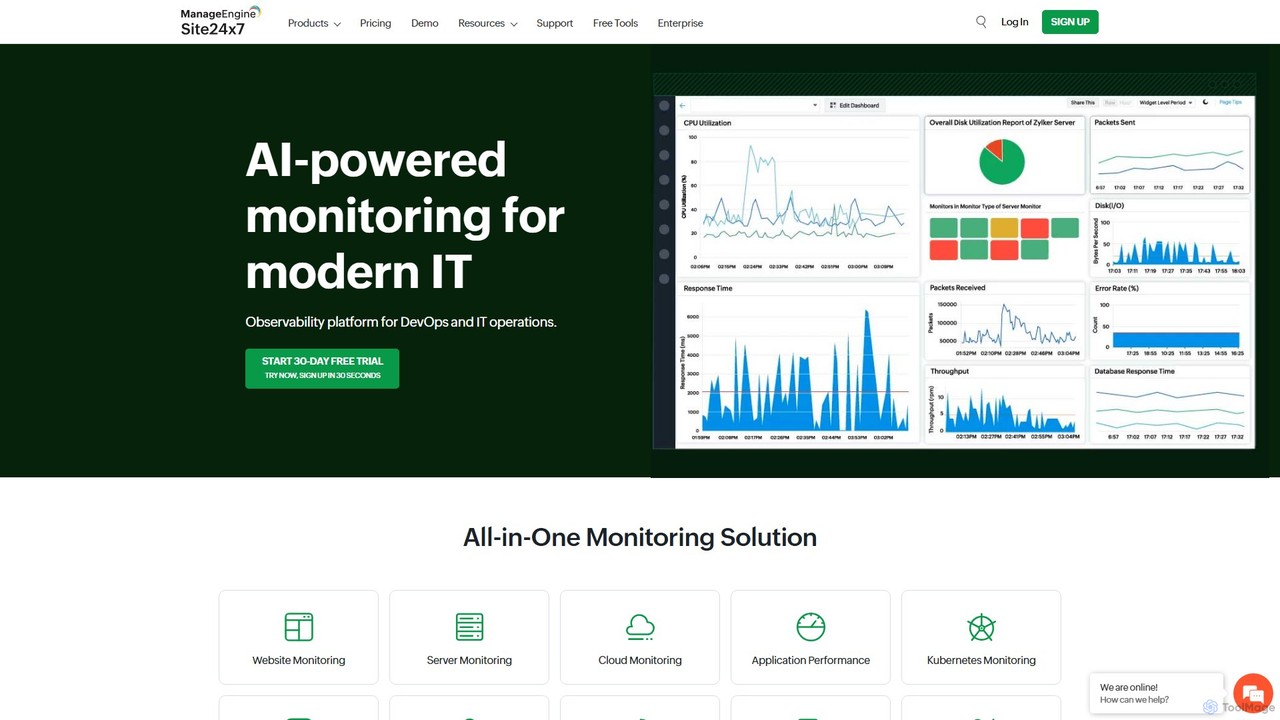
Site24x7 is an AI-powered, all-in-one observability platform for DevOps and IT operations. It provides comprehensive monitoring for websites, servers, cloud infrastructure (AWS, Azure, GCP), networks, and applications from a single console. It helps ensure uptime, troubleshoot performance issues, and optimize user experience.

Observability
Visits 1MFavorites 105Likes 86
KubeHA
Paid

KubeHA

KubeHA is a GenAI-powered SaaS platform for Kubernetes, offering an all-in-one solution for Monitoring, Observability, Remediation, and Exploration (MORE). It unifies logs, metrics, traces, and events to provide AI-driven root cause analysis, smart fix suggestions, and 1-click remediation, eliminating tool sprawl and simplifying complex operations for SRE and DevOps teams.

Devops
Visits 6.7KFavorites 121Likes 137
Mezmo
Freemium

Mezmo

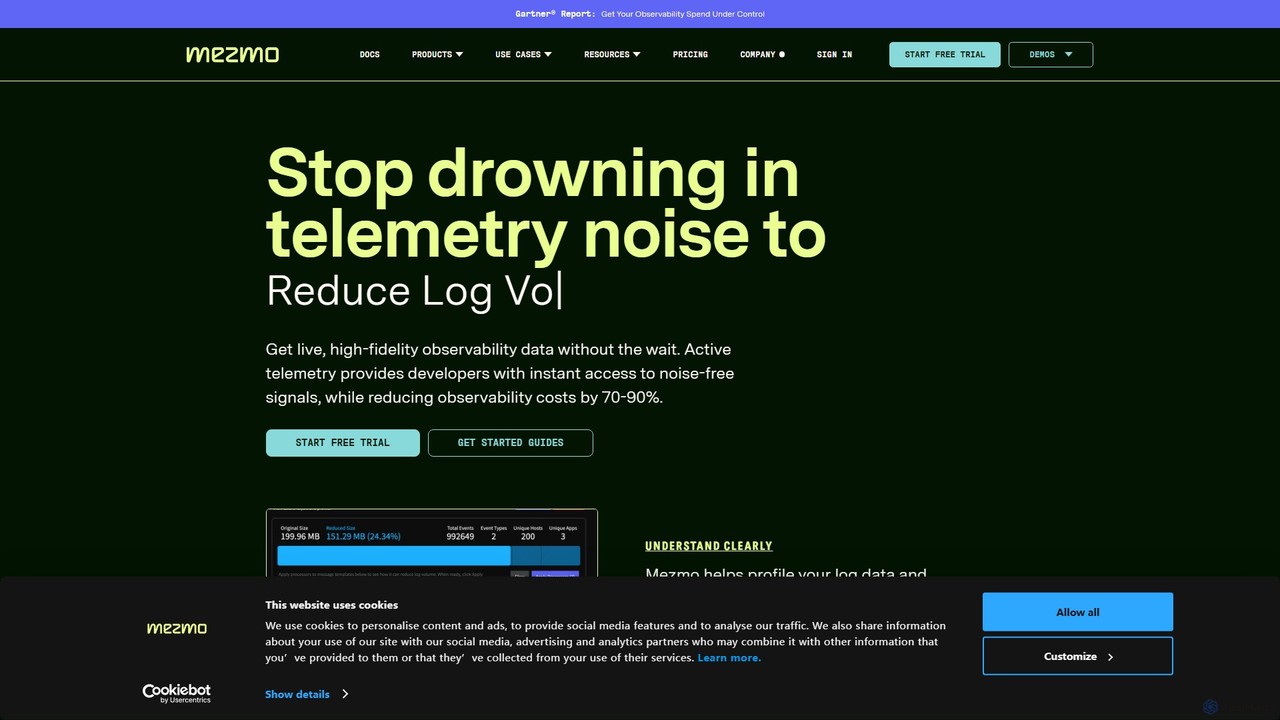
Mezmo is a comprehensive telemetry data pipeline platform designed for developers, DevOps, and SRE teams. It enables users to ingest, process, and analyze logs, metrics, and traces from any source. With a focus on control and cost-efficiency, Mezmo allows you to filter, transform, and route your observability data to any destination, optimizing performance and reducing expenses.

Analytics
Visits 74.5KFavorites 94Likes 106
Splunk
Paid

Splunk

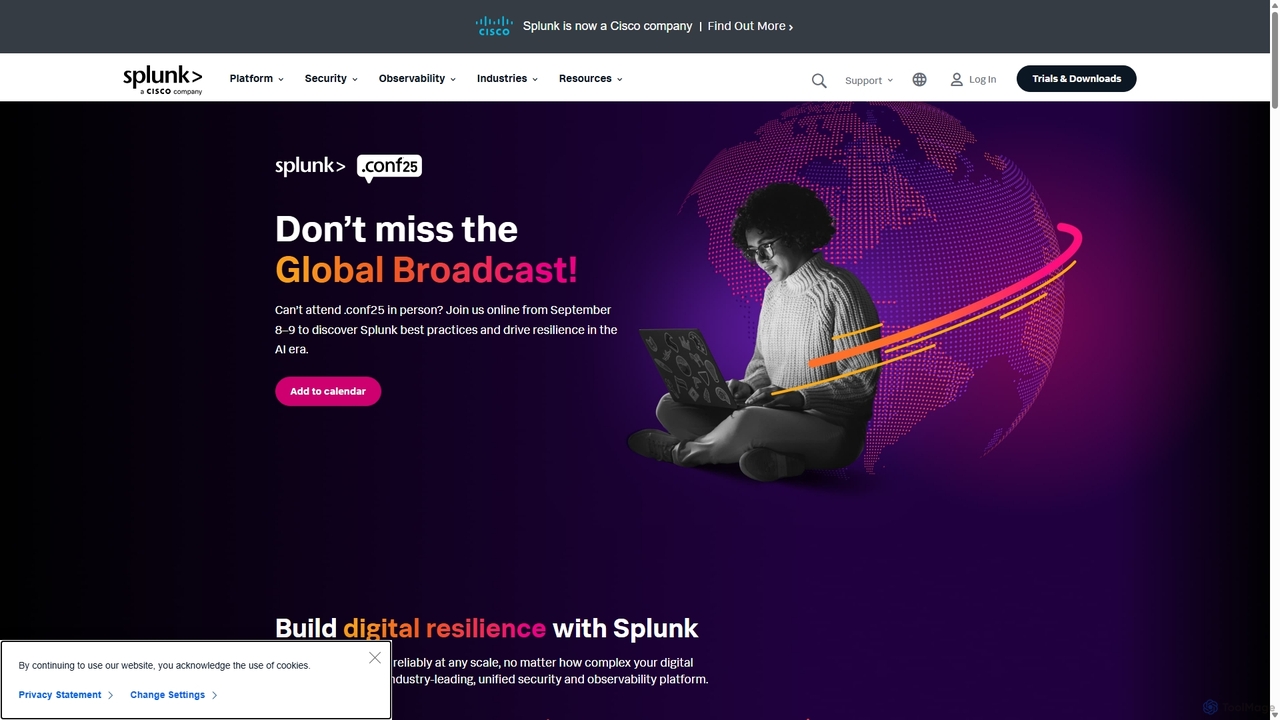
Splunk is the key to enterprise resilience, offering a unified, AI-powered platform for security and observability. It enables organizations to investigate, monitor, analyze, and act on data from any source at any scale. Now a Cisco company, Splunk helps SecOps, ITOps, and engineering teams keep their digital systems secure and reliable in the AI era.

It Operations
Visits 1.2MFavorites 138Likes 138
Metoro
Freemium

Metoro

Metoro is an AI-powered observability platform designed for Kubernetes. It uses eBPF technology for zero-instrumentation monitoring, enabling autonomous issue detection, root cause analysis, and automated code fixes via pull requests. Operational in under a minute, it offers a comprehensive and cost-effective alternative to traditional monitoring tools.

Observability
Visits 13.1KFavorites 93Likes 109
Antimetal
Paid

Antimetal

Antimetal is an AI-powered infrastructure intelligence platform designed for DevOps and SRE teams. It proactively monitors your systems, automatically diagnoses issues, and provides actionable solutions to fix and prevent infrastructure problems, enhancing system reliability and reducing downtime.

Infrastructure & Devops
Visits 24.5KFavorites 122Likes 129
Signal0ne
Paid

Signal0ne

Signal0ne is an AI-powered AIOps platform that acts as an on-call assistant for DevOps and SRE teams. It automates root cause analysis by correlating signals from your existing observability stack, enriching alerts with crucial context, and suggesting mitigation steps. This helps teams reduce alert fatigue and significantly decrease Mean Time To Resolution (MTTR).

Observability
Visits 4.9KFavorites 95Likes 98
drdroid
Freemium

drdroid

drdroid is an AI-powered agent for observability and production monitoring, designed for SRE and DevOps teams. It automates incident investigation by querying and analyzing logs and metrics from multiple sources. By integrating with your existing stack via Slack, it helps reduce alert fatigue, slash MTTR (Mean Time to Resolution), and transform runbooks into self-healing systems, acting as a 24/7 AI SRE.

Monitoring
Visits 131.3KFavorites 111Likes 110
Eyer
Paid

Eyer

Eyer is a headless AIOps and observability platform that uses AI to analyze time-series data from IT, OT, and business systems. It delivers smart, actionable alerts to reduce noise by up to 80%, enabling teams to proactively identify and resolve issues. It integrates seamlessly with existing tools like Grafana and Boomi.

Aiops
Visits 14.2KFavorites 105Likes 119
Observo AI
Paid

Observo AI

Observo AI is an intelligent data pipeline platform for Security and DevOps teams. It uses AI to optimize telemetry data, reducing log volumes by up to 80% and observability costs by over 50%. The platform accelerates threat detection, enriches data in real-time, and eliminates blind spots, making security and operations more efficient and cost-effective.

Data Pipeline
Visits 11.8KFavorites 126Likes 136
Sublyzer
Freemium

Sublyzer

Sublyzer is an AI-powered analytics platform designed for SaaS founders and developers to monitor revenue, track churn, analyze performance, and resolve errors efficiently. It offers a unified dashboard with smart error tracking, AI explanations, and solution suggestions through a conversational interface.

Saas Analytics
Visits 4.2KFavorites 119Likes 111
Resolve.ai
Paid

Resolve.ai

Resolve.ai is an Agentic AI SRE platform that automates incident response and root cause analysis. It acts as a virtual team member on-call, investigating alerts, testing hypotheses, and identifying issues in minutes to reduce MTTR, decrease engineer burnout, and increase system uptime.

Incident Management
Visits 88.3KFavorites 170Likes 154
Anomify
Freemium

Anomify

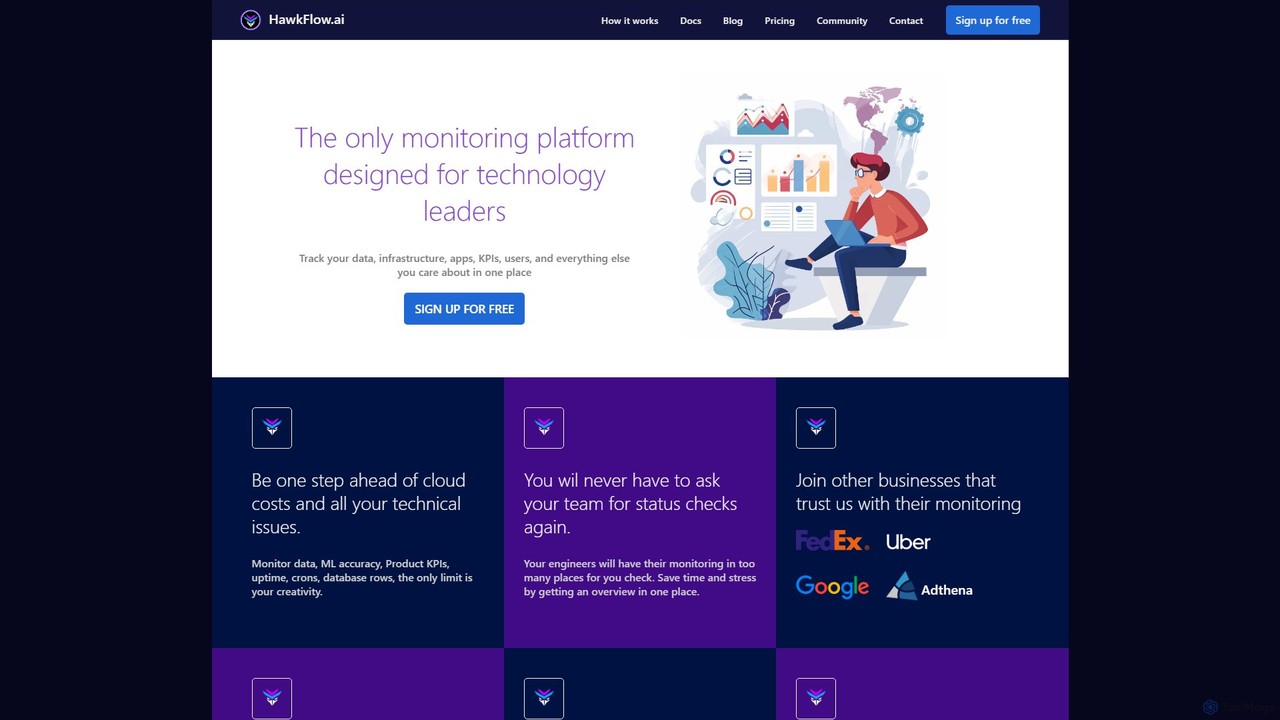
Anomify is an AI-powered early warning platform for critical infrastructure, offering real-time anomaly detection and observability at scale. It leverages multi-stage machine learning to analyze time-series data, significantly reduce false positives, and accelerate root cause analysis. Designed for DevOps, SREs, and IT teams, Anomify transforms monitoring from reactive to proactive, ensuring system performance and reliability.

Anomaly Detection
Visits 5.7KFavorites 117Likes 118
hawkflow.ai
Freemium

hawkflow.ai

HawkFlow.ai is a unified monitoring platform for developers and technology leaders. It allows you to track application performance, infrastructure, data, KPIs, and ML models in one centralized place. With simple code integration, it helps teams proactively identify issues, monitor costs, and gain a comprehensive overview of their entire tech stack.

Monitoring
Visits 4.3KFavorites 111Likes 112