Dashup
Dashup is a no-code AI platform that instantly transforms raw CSV data into stunning, interactive business dashboards. Simply …
Dashup is a no-code AI platform that instantly transforms raw CSV data into stunning, interactive business dashboards. Simply upload your file, choose a template, and let the AI suggest key metrics and visualizations. No SQL or technical skills required. Go from spreadsheet to actionable insights in minutes, making data-driven decisions faster and easier.
SnipOwl
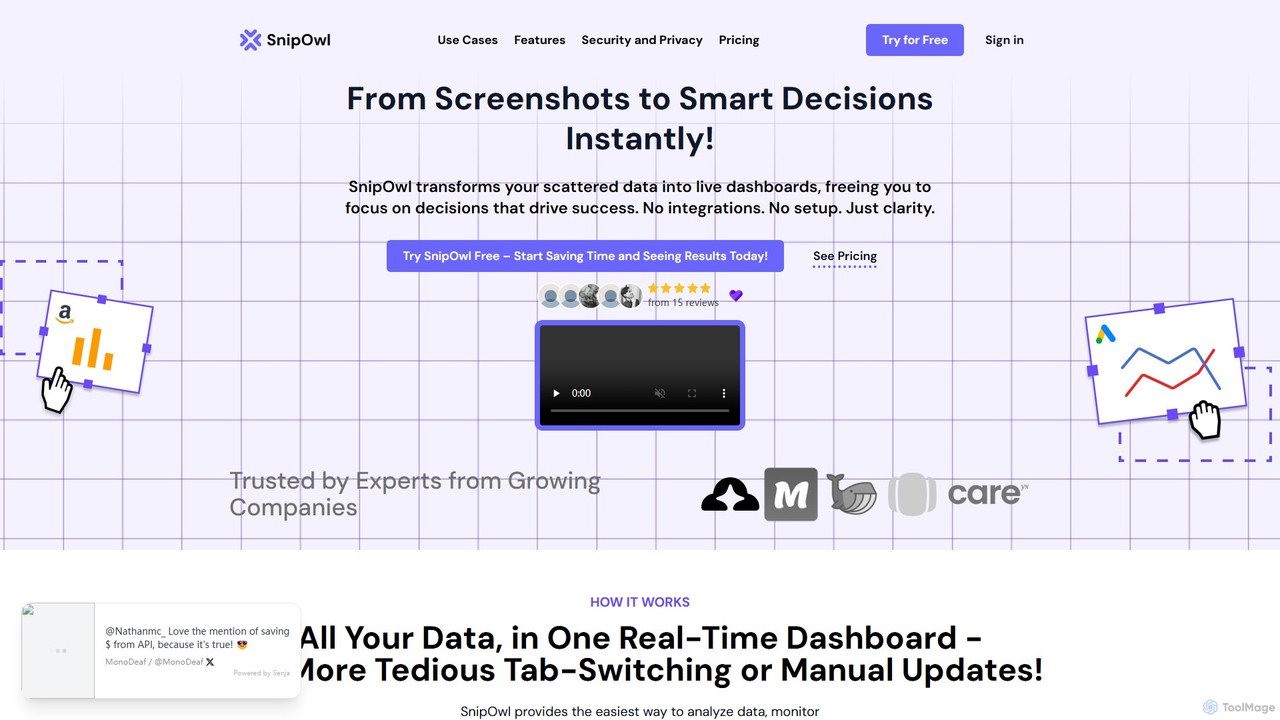
SnipOwl is an innovative tool that transforms static screenshots of any webpage into live, auto-updating dashboards. Using a …
SnipOwl is an innovative tool that transforms static screenshots of any webpage into live, auto-updating dashboards. Using a Chrome extension, you can capture key metrics, charts, or data from various sources without needing complex integrations or APIs. It centralizes your data, allowing for real-time monitoring, faster decision-making, and significant cost savings on API fees. It's ideal for marketers, analysts, and anyone needing a unified view of their data.
ZapDigits
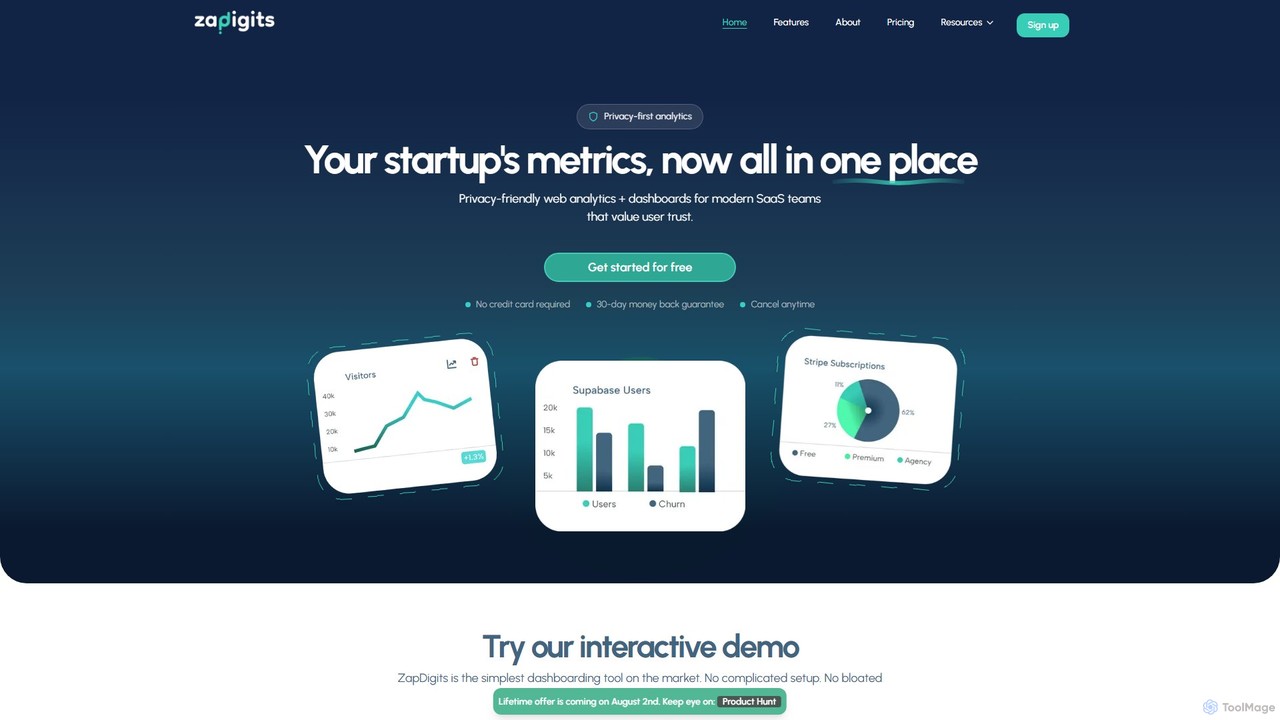
ZapDigits is a privacy-first analytics and dashboarding tool designed for startups and SaaS teams. It consolidates key metrics …
ZapDigits is a privacy-first analytics and dashboarding tool designed for startups and SaaS teams. It consolidates key metrics from various services like Stripe, Supabase, and GitHub into a single, easy-to-understand dashboard. With a no-code setup, it provides clear, actionable insights without the complexity of traditional BI tools, helping founders save time and make data-driven decisions.
preswald
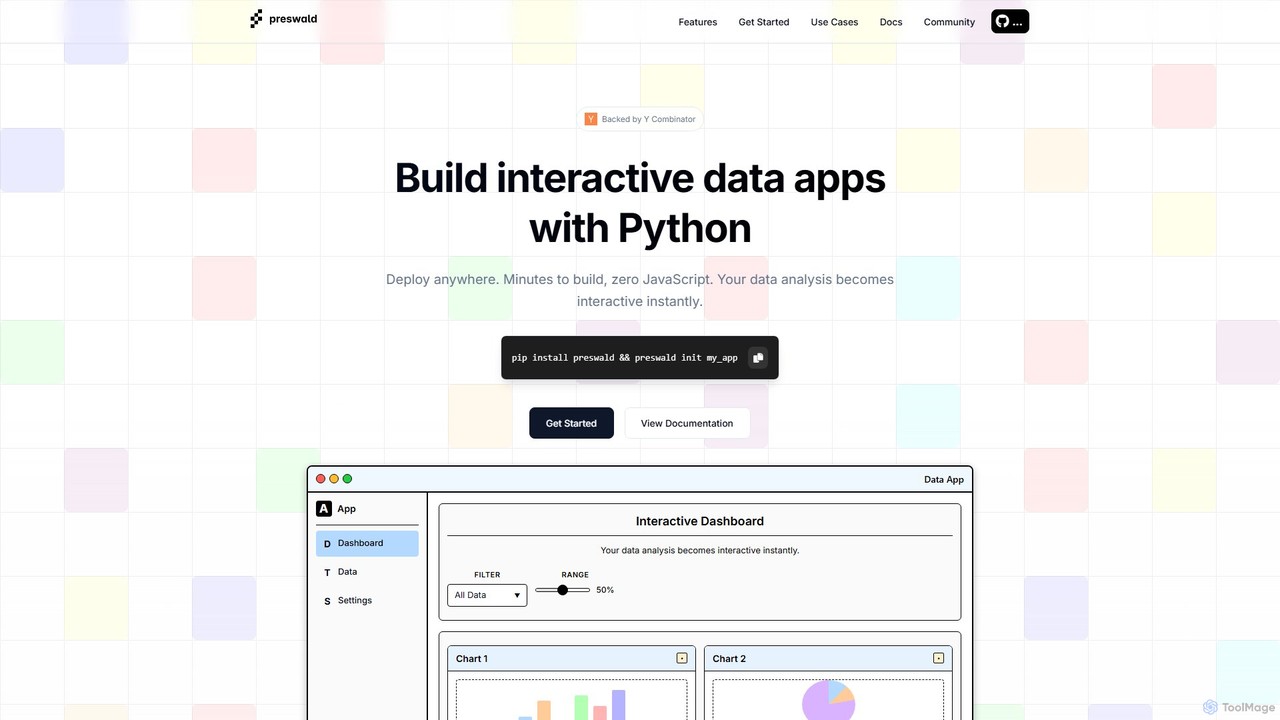
Preswald is a YC-backed tool that empowers data scientists and Python developers to transform their scripts into fully …
Preswald is a YC-backed tool that empowers data scientists and Python developers to transform their scripts into fully interactive web applications without writing any JavaScript. It generates fast, responsive, and deployable static sites that can run anywhere, even offline. Ideal for creating dashboards, reports, and AI-driven data exploration tools with ease.
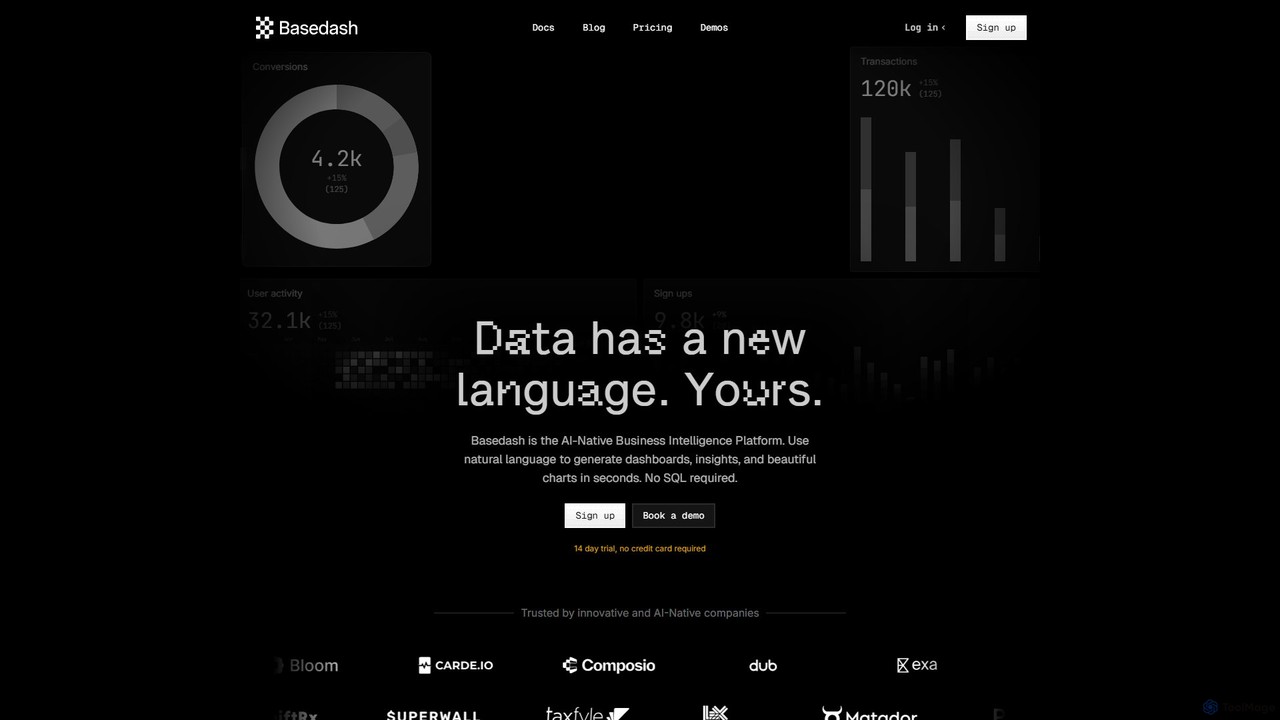
Basedash
Basedash is an AI-native business intelligence platform that allows teams to interact with their data using natural language. …
Basedash is an AI-native business intelligence platform that allows teams to interact with their data using natural language. Generate beautiful dashboards, charts, and insights in seconds without writing any SQL code. Connect your data sources and simply ask questions to get answers.
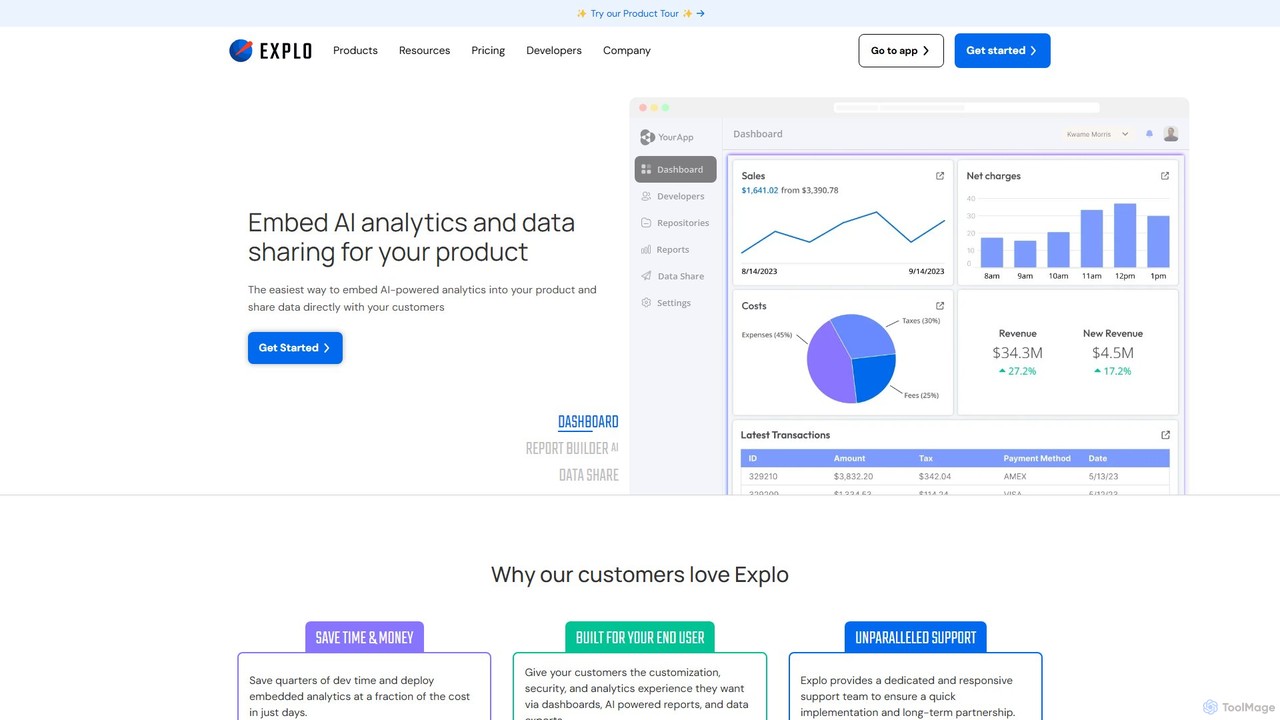
Explo
Explo is a powerful platform for creating and embedding customer-facing analytics and dashboards directly into any application. It …
Explo is a powerful platform for creating and embedding customer-facing analytics and dashboards directly into any application. It allows businesses to connect their databases, build beautiful, customizable data visualizations, and share insights with their users seamlessly. With AI-powered features like a dashboard builder and reporting, Explo helps SaaS, E-commerce, and Fintech companies enhance their product value by providing native, white-labeled analytics experiences without extensive development effort.
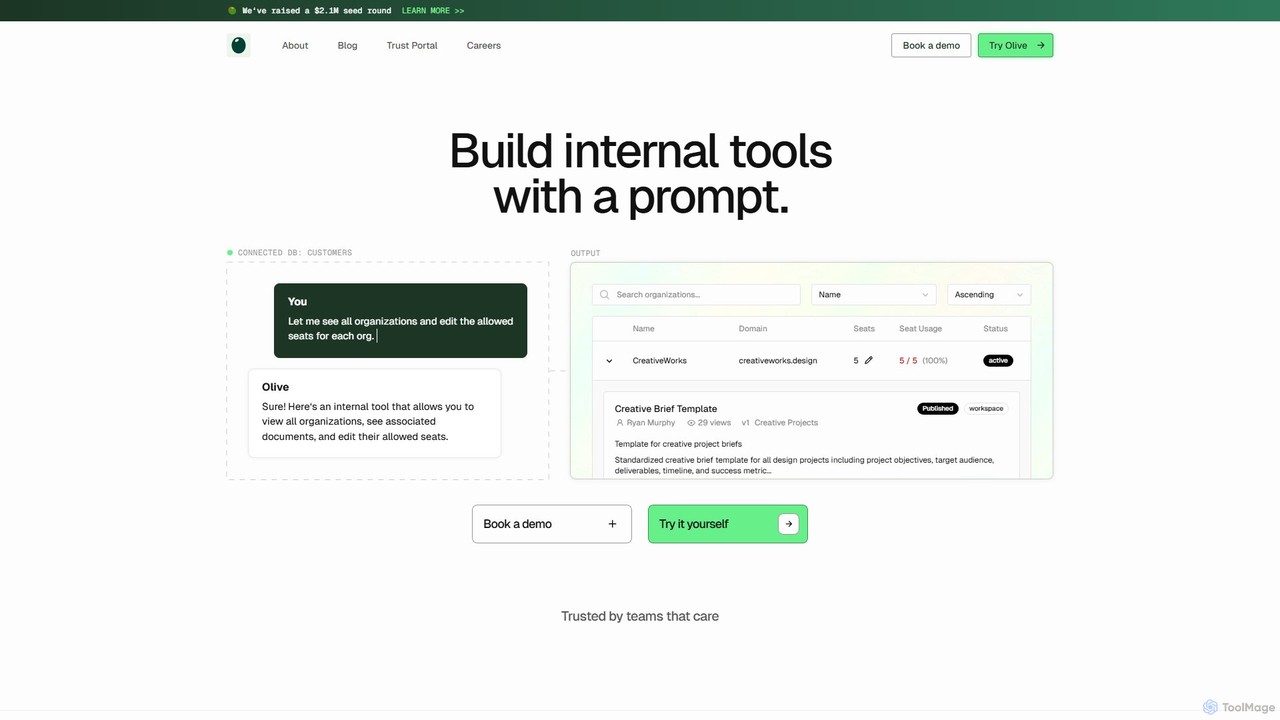
Olive
Olive is an AI-powered platform that enables teams to build and deploy internal tools, dashboards, and admin panels …
Olive is an AI-powered platform that enables teams to build and deploy internal tools, dashboards, and admin panels using simple natural language prompts. By securely connecting to your database, Olive understands your data schema and generates production-ready applications in minutes, freeing up engineering resources to focus on core product development.

Vitruveo
Vitruveo is a comprehensive Web3 platform and dashboard for managing digital assets within its ecosystem. It acts as …
Vitruveo is a comprehensive Web3 platform and dashboard for managing digital assets within its ecosystem. It acts as a central hub for users to track, manage, and interact with their VTRU tokens, NFTs (including the AIWARS collection), and DeFi activities like staking. The platform provides real-time data, financial calculators, and direct smart contract interaction, offering a transparent and powerful tool for crypto investors and NFT collectors.
About Dashboard
AI Dashboard tools are visual interfaces that consolidate and display key data, metrics, and performance indicators from multiple sources onto a single, easily understandable screen. They leverage AI to analyze information, identify trends, and sometimes offer predictive insights, transforming complex datasets into interactive charts, graphs, and reports. This enables individuals and teams to monitor progress in real-time, make informed decisions quickly, and maintain a clear overview of their productivity and operational goals. These tools act as a central command center for data-driven management.
Core Features
- Data Aggregation: Connects to various data sources (like CRM, analytics tools, databases) to pull information into one place.
- Customizable Widgets: Allows users to create personalized views with the specific metrics and visualizations that matter most to them.
- Real-time Updates: Automatically refreshes data to provide the most current view of performance and operations.
- AI-Powered Insights: Utilizes machine learning to detect anomalies, forecast trends, and highlight important patterns in the data.
- Automated Reporting: Generates and distributes regular performance reports to stakeholders, saving manual effort.
Use Cases
AI Dashboards are widely used across various departments. In marketing, they track campaign performance and ROI. For sales teams, they monitor pipelines and individual performance. Operations managers use them to oversee production metrics, while executives get a high-level view of the entire business's health.
How to Choose
When selecting an AI Dashboard tool, consider its integration capabilities with your existing software stack. Evaluate the level of customization and flexibility in creating visualizations. Assess the sophistication of its AI features, such as predictive analytics. Finally, consider its ease of use, scalability, and pricing model to ensure it fits your team's needs and budget.
DashboardUse Cases
Monitoring Real-Time Sales Performance
A sales manager uses an AI dashboard to get a comprehensive, live view of team performance. The tool integrates with the company's CRM, pulling data on leads, conversion rates, and revenue. Customizable widgets display Key Performance Indicators (KPIs) like sales pipeline value and deals closed. The AI component can highlight at-risk deals or forecast quarterly results, enabling the manager to proactively address issues and provide targeted coaching to drive sales growth.
Analyzing Marketing Campaign Effectiveness
A marketing team centralizes data from Google Analytics, social media platforms, and email marketing software into a single dashboard. This provides a holistic view of campaign performance. They can track metrics like click-through rates, conversion costs, and customer engagement across all channels. The AI can identify which audience segments are most responsive or which ad creatives are underperforming, allowing the team to optimize their budget allocation and strategy in real-time for better ROI.
Creating a Personal Productivity Hub
An individual professional or freelancer creates a personal dashboard to manage their daily workflow. It connects to their calendar, to-do list app, project management tool, and email. This central hub displays upcoming appointments, task deadlines, project progress, and unread important emails. By having all critical information in one view, they can better prioritize their day, avoid switching between multiple apps, and maintain focus on their most important work, significantly boosting personal efficiency.
Executive Business Health Overview
A CEO or executive uses a high-level dashboard to monitor the overall health of the business. This dashboard aggregates key metrics from finance (revenue, profit margins), sales (new customers), marketing (brand reach), and operations (production efficiency). Visualizations provide a quick, at-a-glance understanding of performance against strategic goals. AI-driven alerts can notify them of significant deviations from forecasts, enabling swift strategic intervention and informed decision-making at the highest level.
Managing Project Milestones and Resources
A project manager integrates their project management software (like Jira or Asana) with a dashboard tool. This creates a visual command center for tracking multiple projects simultaneously. The dashboard displays task completion rates, budget consumption, resource allocation, and upcoming deadlines. It helps the manager quickly identify bottlenecks or at-risk tasks across all projects, facilitating better resource management and ensuring projects stay on schedule and within budget.
Monitoring Website and App Performance
A development or IT operations team uses a dashboard to monitor the performance of their website or application. It pulls real-time data from sources like Google Analytics, server monitoring tools, and user feedback platforms. The dashboard visualizes key metrics such as server uptime, page load times, user traffic, and error rates. AI-powered anomaly detection can instantly alert the team to unusual spikes in errors or downtime, enabling them to resolve critical issues before they significantly impact users.