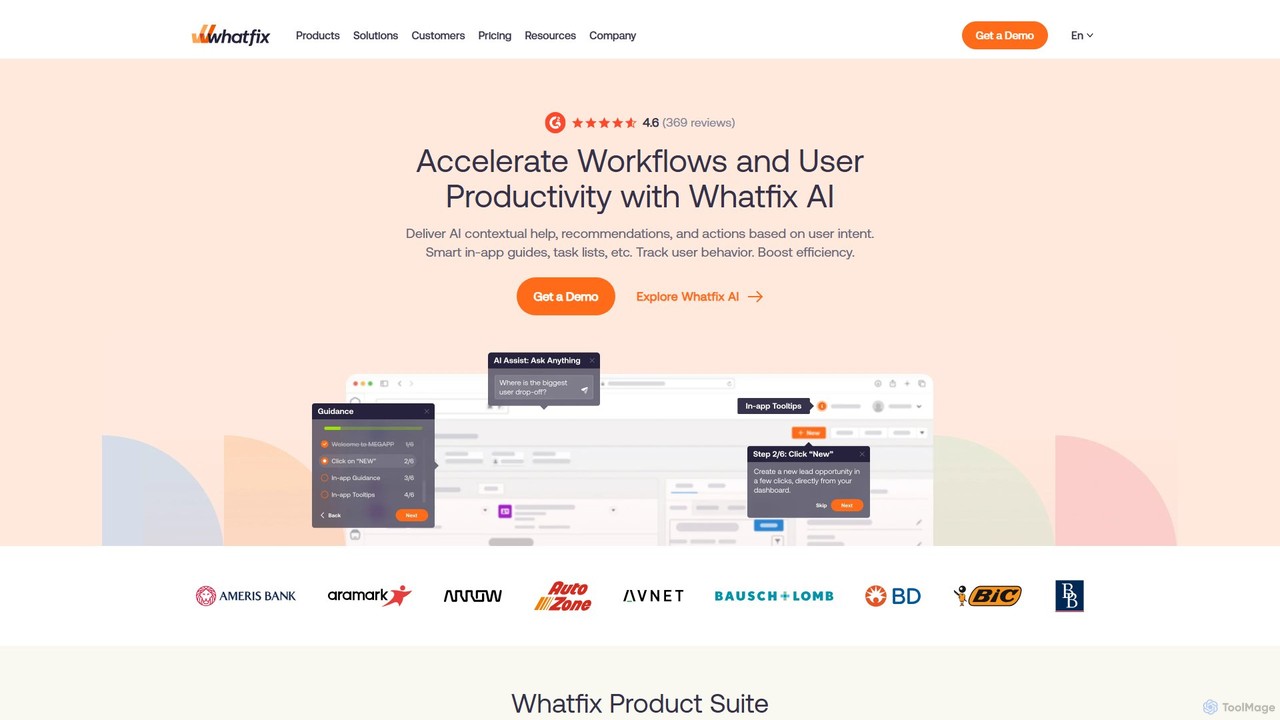
User Analytics tools are AI-powered platforms designed to capture, measure, and analyze user behavior on websites and applications. They utilize machine learning to automatically process vast datasets of user interactions, uncovering patterns, friction points, and behavioral trends that are often missed by traditional analytics. This enables product teams, marketers, and designers to gain deep, qualitative insights into the user experience, leading to data-driven decisions for feature improvement, conversion rate optimization, and user retention. Unlike standard metric reporting, these tools focus on the "why" behind user actions.
Core Features
- Session Replay: Records and plays back individual user sessions, showing mouse movements, clicks, and scrolls to diagnose usability issues.
- Heatmaps: Provides visual representations of where users click, move, and scroll most on a page, highlighting areas of high and low engagement.
- Automated Funnel Analysis: Automatically tracks user progression through key steps (e.g., signup, checkout) and identifies where they drop off.
- Predictive Analytics: Uses AI to forecast user behavior, such as predicting churn risk or identifying users with high conversion potential.
- Behavioral Segmentation: Automatically groups users into segments based on their actions and engagement patterns, enabling targeted personalization.
Applicable Scenarios
These tools are essential for digital-first businesses, particularly in SaaS, e-commerce, and mobile app industries. Product managers use them to validate new features and prioritize backlogs. UX/UI designers analyze session replays to identify and fix usability flaws. Marketers leverage behavioral segments to create personalized campaigns and improve landing page performance.
Selection Criteria
When choosing a User Analytics tool, consider its data privacy and compliance features (e.g., GDPR, CCPA). Evaluate its integration capabilities with your existing tech stack, such as CRM or A/B testing platforms. Assess the tool's scalability to handle your user traffic and the clarity of its data visualization. Finally, balance the depth of analytical features with the ease of use for non-technical team members.