
xyzt.ai Overview
xyzt.ai is a cutting-edge, AI-powered visual analytics platform designed to process, visualize, and analyze massive amounts of spatio-temporal data. It positions itself as the go-to solution for understanding "the world in motion," catering to industries that rely on location and time-series data, such as mobility, traffic management, maritime logistics, and the Internet of Things (IoT). The platform empowers analysts and decision-makers to transform complex datasets—regardless of size—into clear, actionable insights without requiring extensive programming skills. Its core mission is to help organizations monetize their sensor and data investments rapidly and efficiently.
A standout feature is the recently introduced "just ask xyzt.ai™," which leverages Generative AI to allow users to query their data using natural language. This democratizes data analysis, making it accessible to a broader range of users. The platform is built to be data-agnostic, capable of integrating data from various sources, including GPS traces, floating vehicle data (FVD), Automatic Identification System (AIS) data for ships, radar data, and any IoT sensor output. It emphasizes privacy and security, ensuring that sensitive data is protected by design.
How to use xyzt.ai
Using xyzt.ai is a streamlined, self-service process designed for efficiency:
- Connect Your Data: Begin by connecting your own data sources. The platform supports a wide variety of spatio-temporal data formats, including raw GPS traces, map-matched trip paths, and aggregated traffic statistics. You can combine multiple datasets for layered analysis.
- Visualize and Explore: Once data is loaded, use the intuitive dashboarding tools to visualize it on a map over time. The platform's powerful rendering engine handles billions of data points smoothly, allowing for interactive exploration. Features like split-view analysis, area of interest filtering, and trend analytics help you drill down into specifics.
- Ask Questions in Natural Language: Leverage the "just ask xyzt.ai™" feature. Simply type your question, such as "Show me the traffic congestion hotspots in downtown on Monday mornings" or "Identify all vessels that stopped for more than 3 hours near the main channel," and let the GenAI provide the answer visually.
- Perform Advanced Analysis: Utilize built-in analytical tools for deeper insights. This includes origin-destination analysis to understand travel patterns, dwell time analysis to see where vehicles or vessels stop, and AI-powered anomaly detection to spot unusual events like potential collisions or deviations from normal routes.
- Share and Collaborate: Create comprehensive dashboards and reports summarizing your findings. These can be easily shared with colleagues or embedded into other applications. For advanced integration, the REST API (available in higher-tier plans) allows for programmatic access to the platform's capabilities.
Core Features of xyzt.ai
- GenAI-Powered Natural Language Queries: Interact with your data using simple, conversational language to get quick insights.
- Large-Scale Spatio-Temporal Analysis: Natively built to handle and visualize billions of location and time-series data points efficiently.
- Interactive Visual Analytics: Features include trend analytics, segmentation, origin-destination analysis, dwell time analysis, and split-view comparisons.
- Multi-Source Data Integration: Connect and combine various data types, including floating vehicle data, maritime AIS, aviation ADS-B, weather data, and custom IoT sensor data.
- Privacy-by-Design: A secure platform that ensures data protection and privacy, a critical feature for handling sensitive location data.
- AI-Powered Anomaly Detection: Automatically identify unusual patterns or events, such as anomalous vessel movements or dangerous driving situations, for proactive intervention.
- Customizable Dashboards and Reporting: Build and share dynamic dashboards to communicate insights effectively across your organization.
- REST API Access: Enables seamless integration with existing systems and workflows for automated data processing and analysis.
Use Cases for xyzt.ai
xyzt.ai is applied across various industries to solve complex challenges:
- Traffic & Mobility Management: Road authorities like Germany's Autobahn GmbH use the platform to analyze floating car data, reducing traffic study costs by a factor of 10. Cities like Hamburg and Helsinki use it to understand traffic flow, identify bottlenecks, and improve urban planning.
- Maritime & Port Operations: The Port of Antwerp-Bruges uses xyzt.ai to analyze vessel movements from AIS and radar data, detecting anomalies to enhance safety and operational efficiency. Chemical companies like INEOS use it for collision avoidance systems at their jetties.
- IoT Data Monetization: Companies like Spire, which operate satellite constellations, partner with xyzt.ai to offer their customers an easy-to-use tool to analyze maritime, aviation, and weather data, unlocking new value from their data assets.
- Road Safety Analysis: Partners like Bridgestone use the platform to analyze data on dangerous driving events (harsh braking, acceleration, cornering) to help municipalities improve road safety.
Advantages of xyzt.ai
The platform offers significant competitive advantages:
- Speed and Efficiency: Drastically shortens the time from data to insight, turning projects that once took months into tasks that can be completed in days.
- Scalability: Engineered to handle big data with ease, supporting datasets with over a billion records without compromising performance.
- Ease of Use: The self-service, no-code interface, combined with GenAI-powered queries, makes advanced analytics accessible to non-technical users.
- Cost-Effectiveness: Delivers a high return on investment by reducing reliance on expensive, time-consuming outsourced consultancy and manual analysis.
- Industry Agnostic: While strong in mobility and maritime, its flexible architecture is applicable to any industry with spatio-temporal data, including aviation, mining, logistics, and environmental monitoring.
Pricing and Plans
xyzt.ai offers a tiered pricing structure to suit different organizational needs. Users are encouraged to request a demo for detailed pricing.
- TEAM: Designed for advanced space-time visual analytics. It includes support for geometry, movement, and time-series data, various analysis tools, and dashboarding. This plan is for up to 2 users, with a 100GB data limit and 250 million records per dataset.
- AT SCALE: Includes all features of the TEAM plan, plus support for movement path data and REST API access. It accommodates up to 5 users, with a 500GB data limit and 1 billion records per dataset. Data stores and sharing/embedding are available as optional components.
- ENTERPRISE: The most comprehensive plan. It includes all features of AT SCALE with unlimited users, unlimited data, support for over 1 billion records per dataset, and the option for on-premise deployment for maximum security and control.
xyzt.ai Comments (0)
Log in to post comments
Log in nowxyzt.aiWebsite Traffic Analysis
Latest Traffic
Status
Monthly Traffic Trend
Geography
Top 5 Countries/Regions
-
🇺🇸 United States88.36%
-
🇩🇪 Germany11.64%
Popular Keywords
| Keyword | Cost Per Click |
|---|---|
|
$0.38
|
|
|
$0.18
|
|
|
$0.44
|
|
|
$0.00
|
|
|
$0.00
|
xyzt.ai Alternatives
View All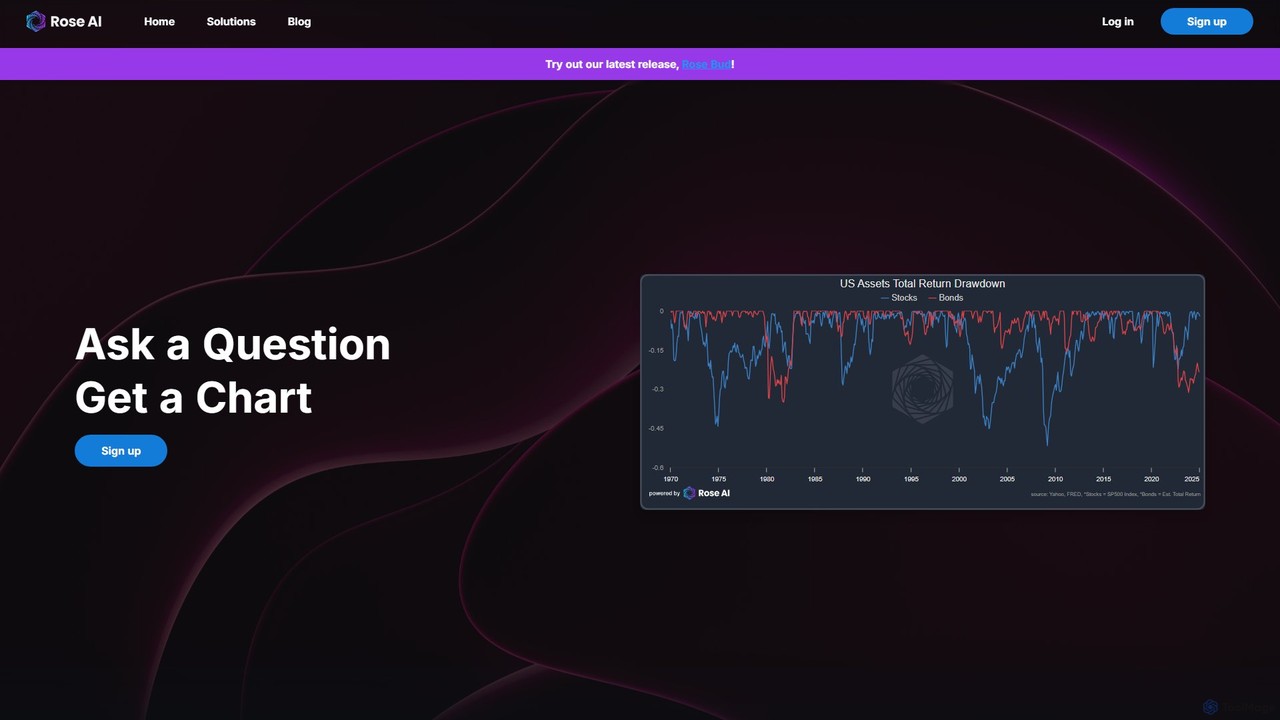
Rose
Rose is an AI-powered data platform designed for financial analysts and decision-makers. It leverages advanced language models to …
Rose is an AI-powered data platform designed for financial analysts and decision-makers. It leverages advanced language models to simplify data discovery, analysis, and visualization. Users can ask questions in natural language to instantly generate charts and insights from diverse data sources. The platform emphasizes data traceability, collaboration, and creating compelling data narratives, streamlining the entire financial research process.
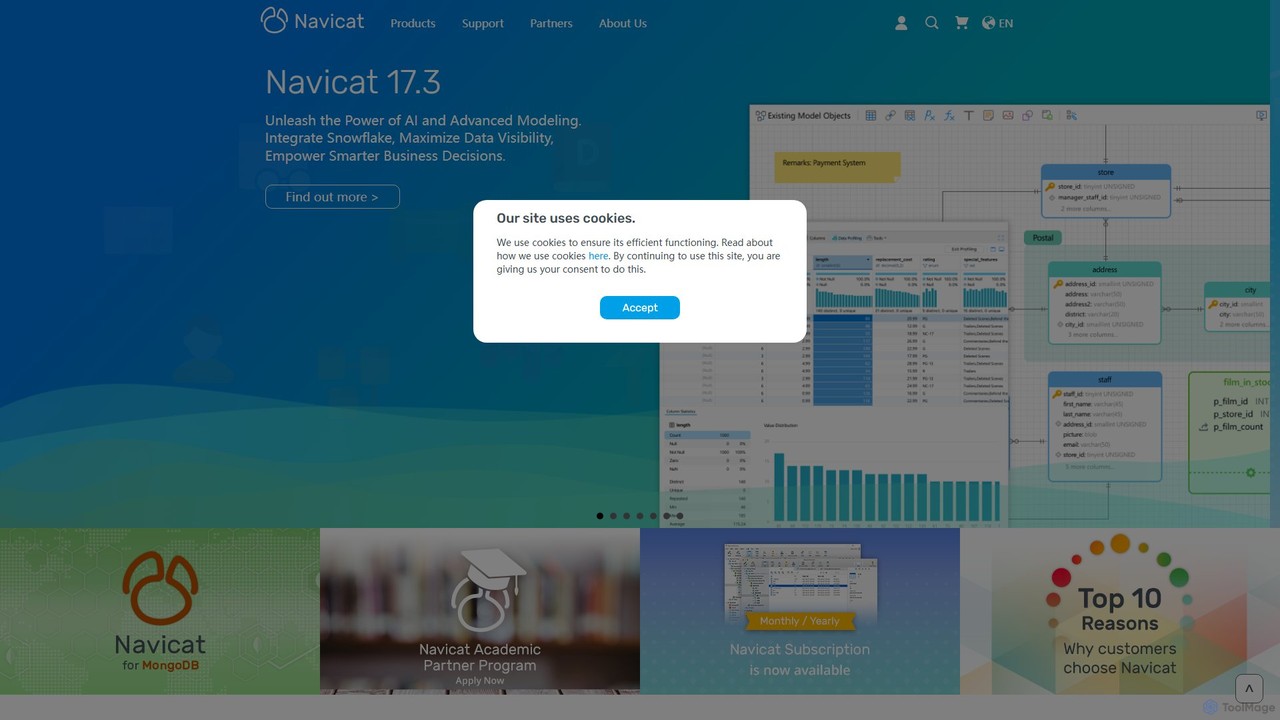
Navicat
Navicat is a comprehensive database management and development tool with integrated AI features. It provides a user-friendly GUI …
Navicat is a comprehensive database management and development tool with integrated AI features. It provides a user-friendly GUI for managing a wide range of databases like MySQL, PostgreSQL, MongoDB, and Snowflake. It boosts productivity with an AI Assistant for query generation, advanced data modeling, BI visualization, and seamless cloud collaboration, making it a top choice for developers, DBAs, and data analysts.
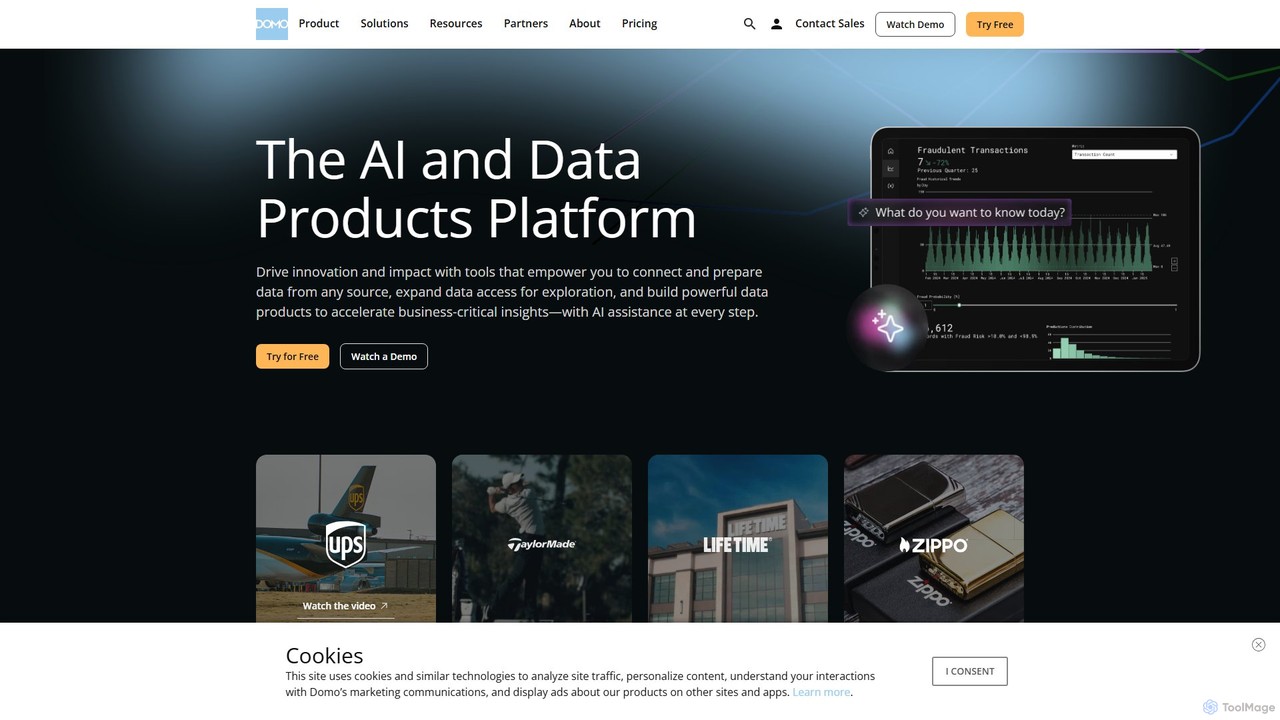
Domo
Domo is an AI-powered cloud platform that integrates all your business data, providing real-time analytics, interactive dashboards, and …
Domo is an AI-powered cloud platform that integrates all your business data, providing real-time analytics, interactive dashboards, and automated workflows. It empowers users to build data products, create AI agents, and make faster, data-driven decisions across the entire organization.
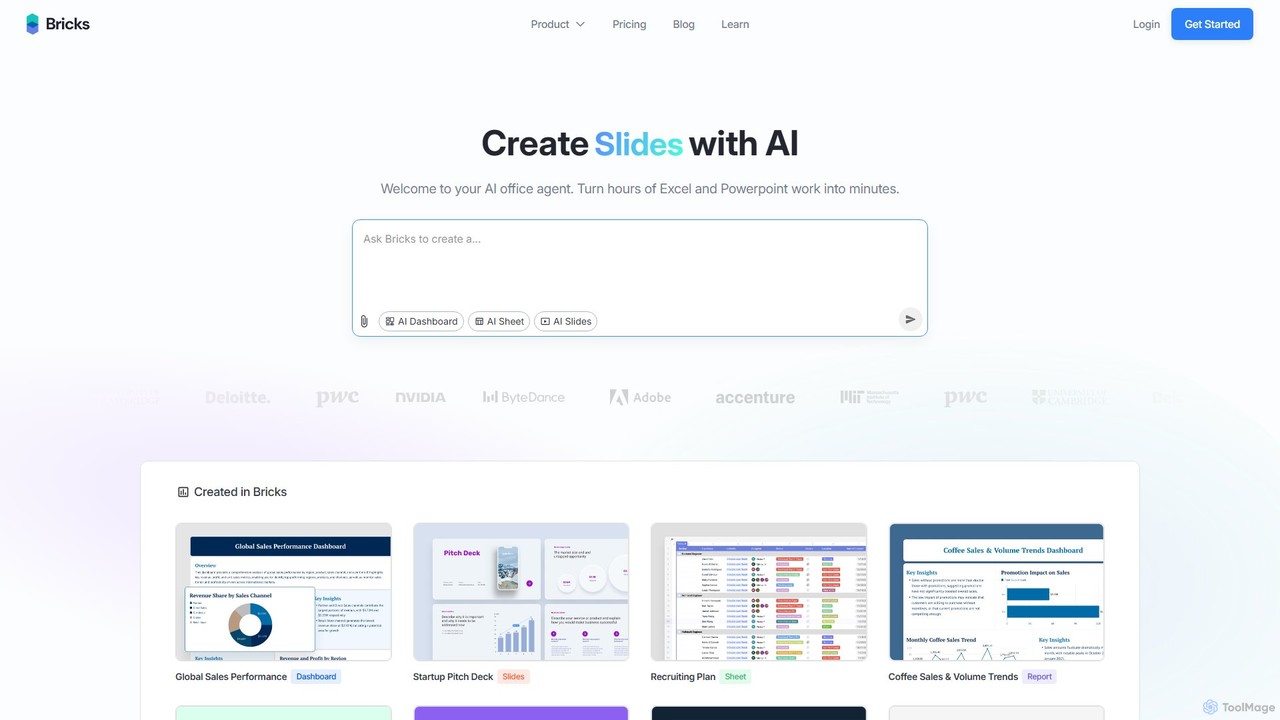
thebricks
thebricks is an AI-powered workspace that transforms data analysis and reporting. It allows users to create interactive dashboards, …
thebricks is an AI-powered workspace that transforms data analysis and reporting. It allows users to create interactive dashboards, dynamic spreadsheets, and professional slides using simple natural language prompts. Turn hours of manual work in Excel and PowerPoint into minutes, streamlining your workflow and boosting productivity.
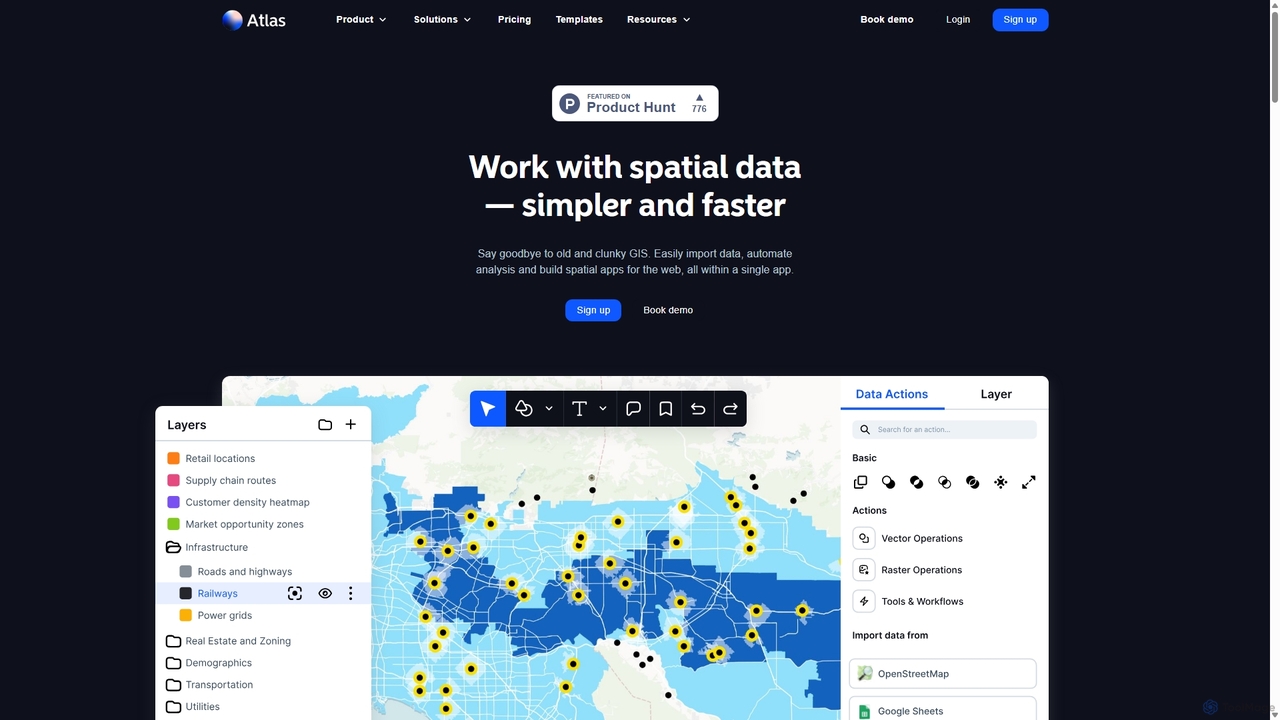
Atlas
Atlas is an all-in-one, browser-based GIS platform that simplifies spatial data analysis and map creation. It enables users …
Atlas is an all-in-one, browser-based GIS platform that simplifies spatial data analysis and map creation. It enables users to easily import data, perform over 50 advanced spatial analyses, and build interactive web maps without prior GIS expertise. Designed for collaboration, Atlas is ideal for teams in sales, marketing, real estate, and environmental analysis to visualize data, identify trends, and make informed, location-driven decisions.
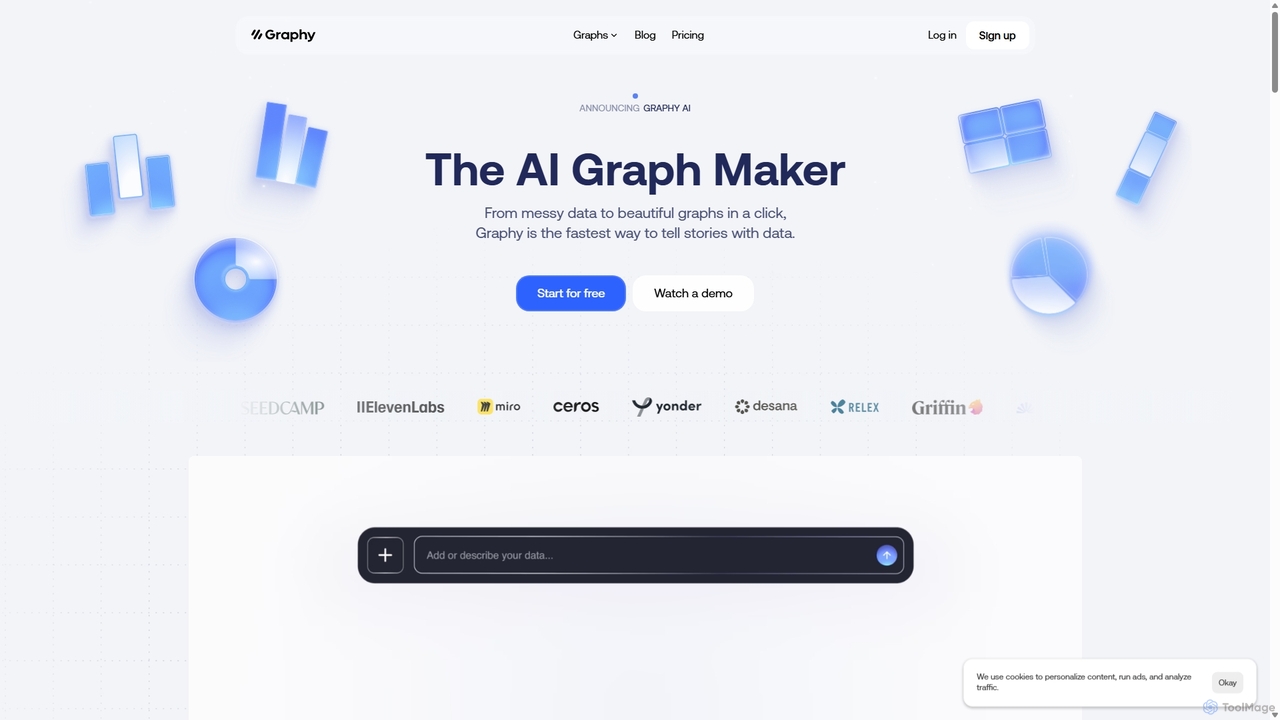
Graphy
Graphy is an AI-powered data visualization tool that transforms raw data into beautiful, interactive charts and graphs in …
Graphy is an AI-powered data visualization tool that transforms raw data into beautiful, interactive charts and graphs in seconds. It simplifies data storytelling by automatically identifying key insights, allowing users to chat with their data, and offering extensive customization. Ideal for marketers, analysts, and teams who need to create compelling visual reports and presentations without complex software.

Analytics Model
Analytics Model is a GenAI-powered conversational analytics platform that transforms your business data into expert insights instantly. Connect …
Analytics Model is a GenAI-powered conversational analytics platform that transforms your business data into expert insights instantly. Connect to over 500 data sources, ask questions in natural language, and create powerful, customizable visualizations to empower strategic decision-making and streamline your data processes.
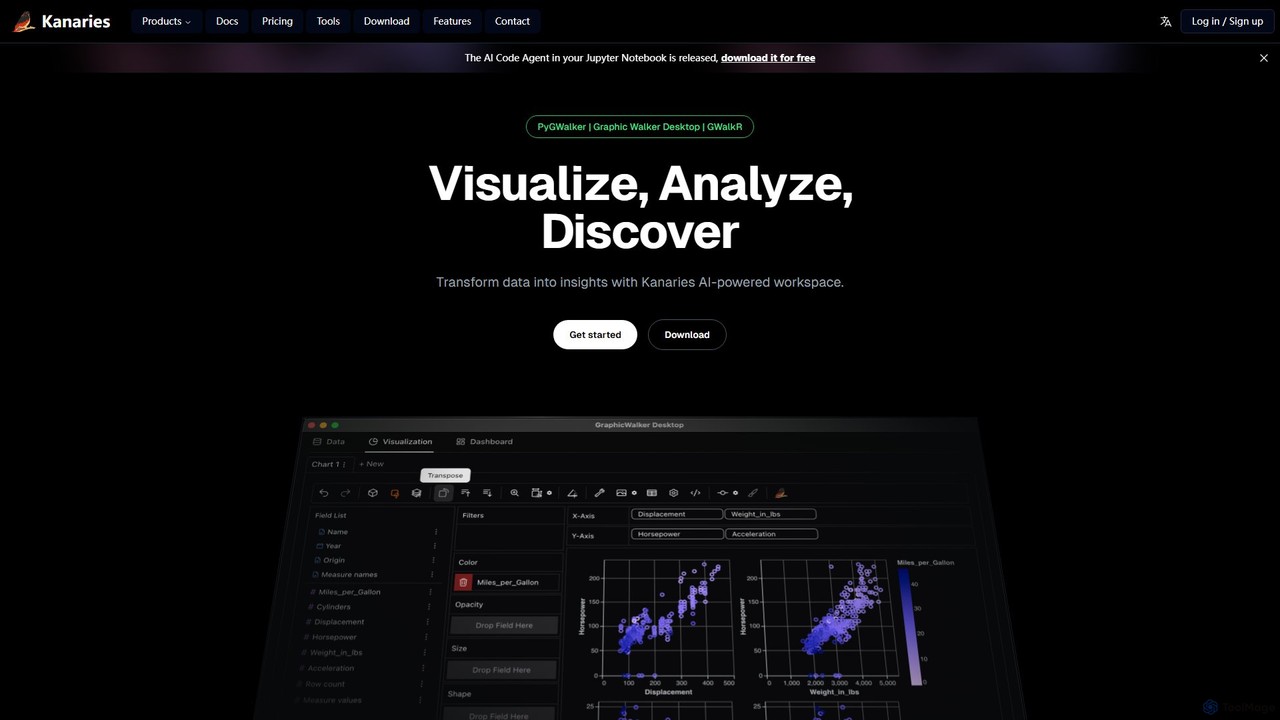
Kanaries
Kanaries is an AI-powered workspace designed for exploratory data analysis (EDA) and visualization. It offers a suite of …
Kanaries is an AI-powered workspace designed for exploratory data analysis (EDA) and visualization. It offers a suite of tools, including PyGWalker for Python and GWalkR for R, that transform dataframes into interactive visual analytics applications with a single line of code. It features a drag-and-drop interface, AI-powered chat for data querying, and collaborative features, streamlining the entire data-to-insight workflow for analysts, data scientists, and developers.
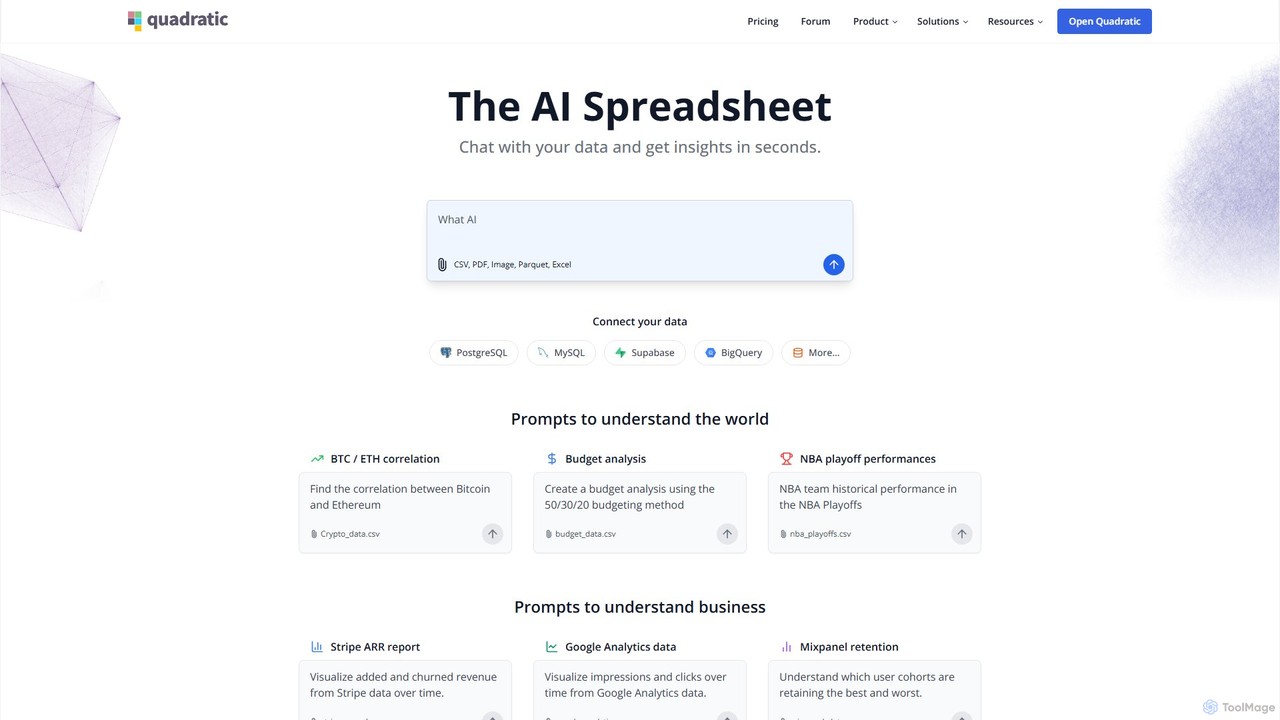
Quadratic
Quadratic is a powerful AI spreadsheet that integrates a familiar interface with Python, SQL, and natural language prompts. …
Quadratic is a powerful AI spreadsheet that integrates a familiar interface with Python, SQL, and natural language prompts. Connect directly to live databases, analyze data, extract information from PDFs, and create visualizations instantly. It's a secure, collaborative platform for data analysts, business professionals, and developers.
Syft Analytics
Syft Analytics is an AI-first financial reporting platform that transforms complex financial data into beautiful, insightful reports, dashboards, …
Syft Analytics is an AI-first financial reporting platform that transforms complex financial data into beautiful, insightful reports, dashboards, and forecasts. It connects with your accounting, e-commerce, and payroll software to provide a unified view of your business performance. Ideal for accountants, advisors, and businesses, Syft automates reporting, simplifies consolidations, and provides AI-driven insights to facilitate better decision-making.
xyzt.ai Category
xyzt.ai Tag
xyzt.ai AI Tool Comparison
xyzt.ai Embed Feature
Just copy the embed code below and paste this beautiful badge on your blog, article, or official app website to drive traffic directly to this tool's detail page and quickly boost your exposure and user count!

No comments yet, be the first to comment!