ToolMage
Sign in

Best 5 Data Analytics AI tools for Data

Popular Data Analytics AI tools in Data include Google Cloud, IBM, AI Superior, UrbanKisaan, and Ojamu, helping you work more efficiently.

AI Superior
Paid

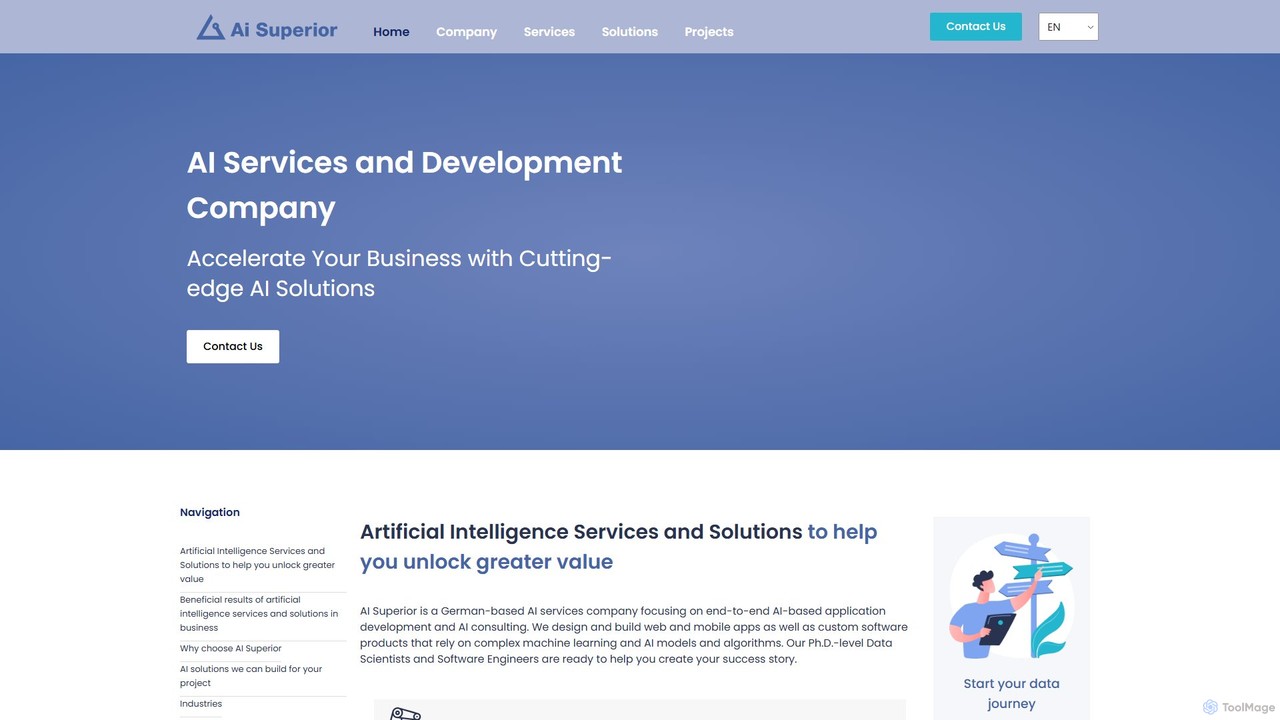
AI Superior

AI Superior is a German-based AI development and consulting company offering end-to-end custom AI solutions. They specialize in computer vision, NLP, predictive analytics, and generative AI for various industries, leveraging a team of PhD-level experts to transform business challenges into scalable, data-driven applications.

Ai Consulting
Visits 20.6KFavorites 132Likes 135
UrbanKisaan
Freemium

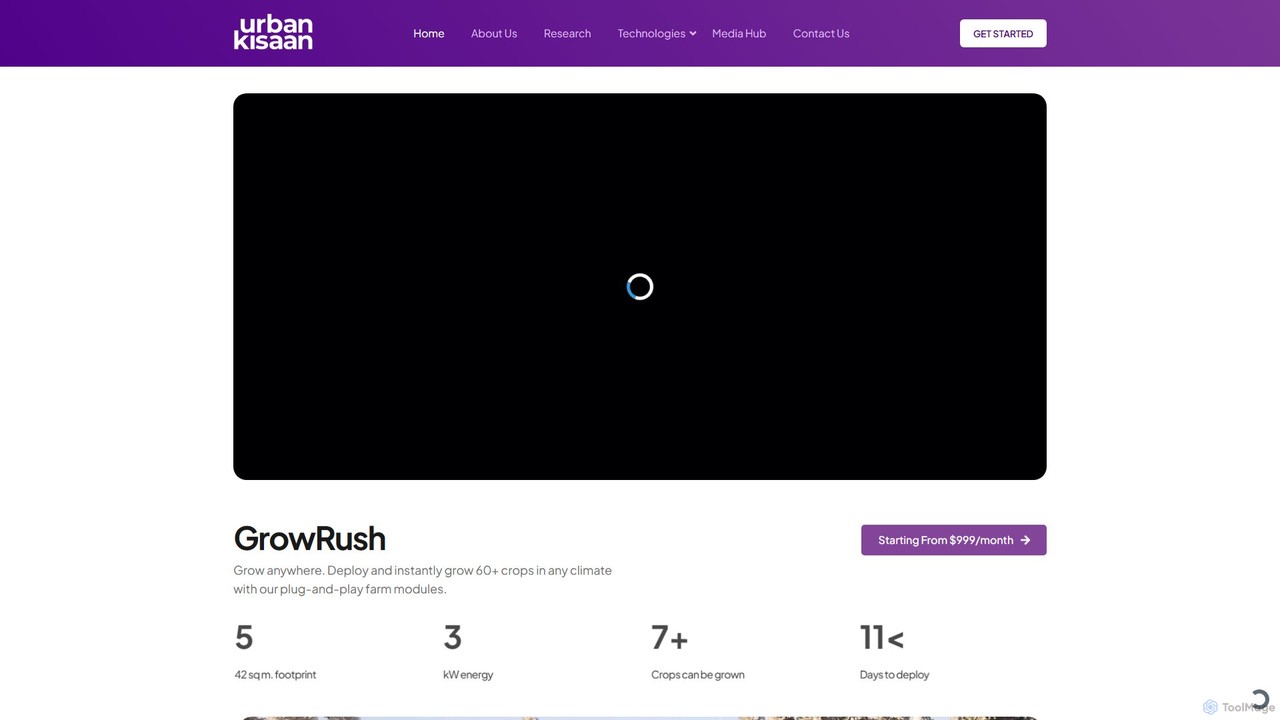
UrbanKisaan

UrbanKisaan is a comprehensive agricultural intelligence platform that leverages AI to create climate-resilient farming solutions. It offers a suite of products including FarmOS.ai for farm management, GeneRush for accelerated seed breeding, and GrowRush for modular vertical farms. By integrating satellite, sensor, and ground-level data, UrbanKisaan provides actionable insights to enhance crop yield, reduce water usage, and promote sustainable agriculture for farmers, researchers, and governments worldwide.

Agriculture
Visits 18.8KFavorites 151Likes 147
Google Cloud
Freemium

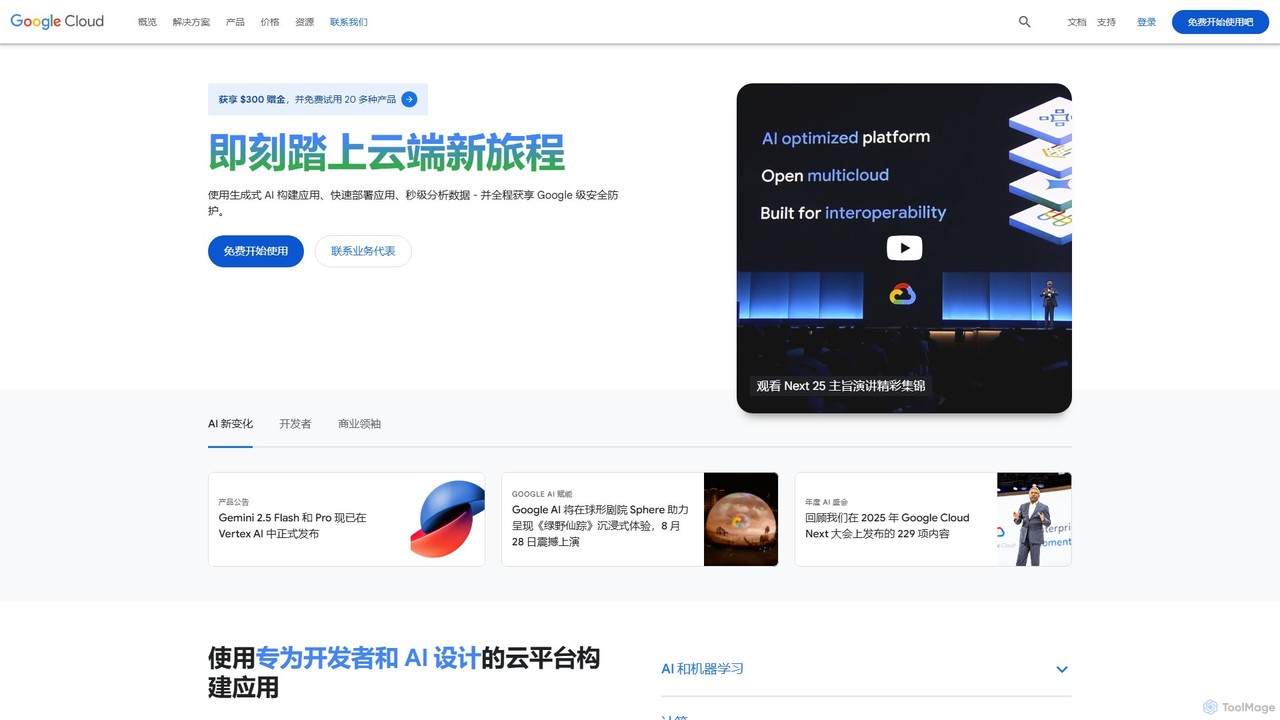
Google Cloud

Google Cloud is a comprehensive suite of cloud computing services that provides infrastructure, platform, and serverless environments. It excels in AI/ML with Vertex AI and Gemini, data analytics with BigQuery, and offers scalable, secure infrastructure for businesses of all sizes, from startups to global enterprises.

Machine Learning
Visits 48.8MFavorites 120Likes 147
IBM
Freemium

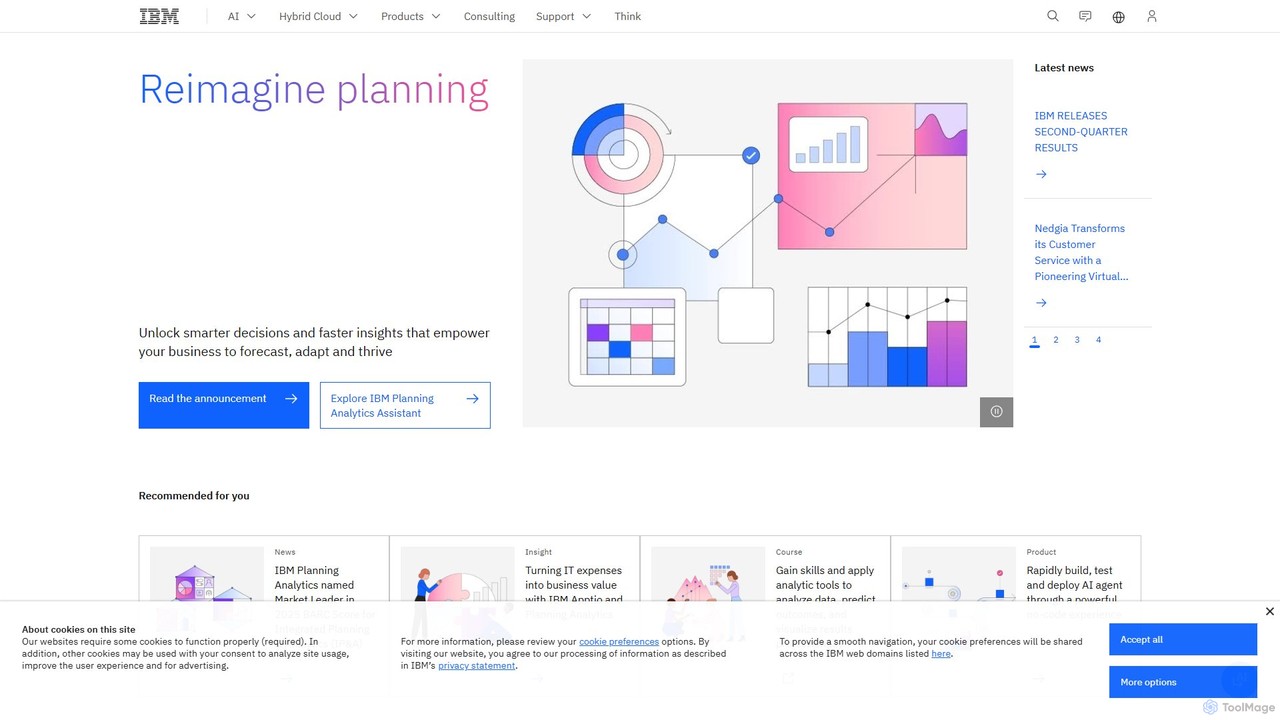
IBM

IBM offers a comprehensive enterprise AI and hybrid cloud platform, watsonx, designed to help businesses build, scale, and govern AI with trust and transparency. It provides access to IBM's proprietary Granite foundation models, open-source models, a fit-for-purpose data store, and an AI governance toolkit, empowering organizations to accelerate innovation and automate processes securely.

Enterprise Solutions
Visits 16.6MFavorites 119Likes 98
Ojamu

Ojamu

Ojamu is an AI-powered MarTech platform designed for the Web3, blockchain, and metaverse ecosystems. It utilizes AI and blockchain data to analyze vast datasets, predict optimal marketing strategies, and provide brands with actionable intelligence to succeed in the new digital economy.

Data Analytics
Visits 6.4KFavorites 105Likes 116

About Data Analytics

AI Data Analytics tools are a specialized category of software designed to automatically process, interpret, and uncover insights from large datasets. Leveraging machine learning algorithms and statistical models, these tools can identify trends, predict future outcomes, and detect anomalies without extensive manual intervention. They empower businesses to make data-driven decisions, from optimizing marketing campaigns and supply chains to understanding customer behavior. Unlike general data management tools, AI data analytics focuses on generating predictive and prescriptive insights, moving beyond simple descriptive reporting.

Core Features

  • Predictive Modeling: Forecasts future trends, sales, or customer behaviors based on historical data patterns.
  • Automated Anomaly Detection: Automatically identifies unusual patterns or outliers that may indicate fraud, system errors, or new opportunities.
  • Natural Language Querying (NLQ): Allows users to ask questions about their data in plain language and receive instant answers and visualizations.
  • Root Cause Analysis: Drills down into data to automatically identify the underlying drivers of specific outcomes or key performance indicators.
  • Customer Segmentation: Groups customers into distinct clusters based on behavior, demographics, or purchase history for targeted marketing.

Use Cases

These tools are primarily used by business analysts, data scientists, marketing managers, and operations teams in sectors like e-commerce, finance, and healthcare. Common applications include customer churn prediction, sales forecasting, fraud detection, and operational efficiency analysis.

How to Choose

When selecting a tool, consider its integration capabilities with your existing data sources (e.g., CRM, databases). Evaluate the complexity of its modeling features against your team's technical skills. Assess the clarity of its visualizations and reporting outputs, and compare pricing models based on data volume or user seats.

Data Analytics use cases

1

Predicting Customer Churn for Subscription Services

A marketing manager at a SaaS company aims to proactively reduce customer churn. They feed historical user activity data—such as login frequency, feature usage, and support ticket history—into an AI analytics tool. The tool builds a predictive model that identifies customers at a high risk of canceling their subscription within the next 30 days. Based on this insight, the marketing team can target these at-risk users with personalized retention offers, proactive support, or educational content, effectively reducing the overall churn rate by a measurable percentage.

2

Optimizing E-commerce Sales with Market Basket Analysis

An e-commerce manager wants to increase the average order value. By feeding transaction data into an AI analytics platform, they can perform a market basket analysis. The tool automatically identifies which products are frequently purchased together. For example, it might discover that customers who buy a specific coffee maker also tend to buy a certain brand of coffee filters. Armed with this knowledge, the manager can create targeted product bundles, optimize 'Frequently Bought Together' recommendations on product pages, and design more effective cross-selling email campaigns, leading to a direct increase in revenue per customer.

3

Automating Financial Fraud Detection in Real-Time

A risk manager at a financial institution needs to identify fraudulent credit card transactions instantly. An AI data analytics tool is deployed to continuously monitor transaction streams. It uses anomaly detection algorithms to learn each customer's normal spending patterns (e.g., typical locations, amounts, merchants). When a transaction deviates significantly from this established pattern, it is automatically flagged in real-time for review or blocked. This process significantly reduces financial losses from fraud while minimizing false positives that could inconvenience legitimate customers.

4

Forecasting Demand for Supply Chain Management

A supply chain manager for a retail company needs to avoid stockouts or overstocking products. They use an AI analytics tool to generate accurate demand forecasts. The tool analyzes historical sales data, seasonality, promotional calendars, and even external factors like economic indicators or weather patterns. By producing more reliable predictions than traditional methods, the tool helps the manager optimize inventory levels, improve production planning, and reduce storage costs. This ensures products are available when customers need them without tying up excess capital in unsold stock.

5

Analyzing Customer Sentiment from Reviews and Social Media

A product manager wants to understand public perception of a new product launch. Instead of manually reading thousands of comments, they use an AI analytics tool to ingest unstructured text data from online reviews, social media posts, and support chats. The tool's Natural Language Processing (NLP) capabilities automatically classify sentiment as positive, negative, or neutral. It also identifies and groups recurring themes or complaints, such as 'difficulty with setup' or 'love the new design'. This provides rapid, unbiased feedback, allowing the product team to prioritize feature improvements and the marketing team to address common concerns.

6

Identifying Inefficiencies in Business Operations

An operations analyst in a large enterprise wants to identify bottlenecks in their order fulfillment process. They connect an AI analytics tool to various operational systems like their ERP and CRM. The tool performs a root cause analysis, automatically identifying why certain steps are taking longer than expected or where errors frequently occur. For instance, it might reveal that delays are consistently linked to a specific warehouse or a particular shipping carrier. This allows management to visualize process flows, pinpoint the exact sources of inefficiency, and implement targeted improvements to enhance speed and reduce costs.

Data Analytics FAQ

What are AI Data Analytics tools?

AI Data Analytics tools are applications that use machine learning and artificial intelligence to automatically analyze large datasets. They go beyond traditional business intelligence (BI) by not just describing what happened, but also predicting what will happen (predictive analytics) and suggesting what actions to take (prescriptive analytics). Key functions include identifying patterns, forecasting trends, and detecting anomalies to help businesses make smarter, data-driven decisions without needing a team of data scientists for every query.

How do I choose the right AI Data Analytics tool?

Choosing the right tool depends on several key factors. Consider the following:

  • Integration: Ensure the tool can easily connect to your existing data sources, such as databases, cloud storage, and CRM systems.
  • User Skill Level: Assess whether you need a user-friendly, no-code platform for business analysts or a more advanced tool with coding capabilities for data scientists.
  • Analytical Needs: Identify the specific functions you require, such as sales forecasting, anomaly detection, or customer segmentation. Not all tools excel in every area.
  • Scalability and Cost: Evaluate the pricing model (per user, per data volume) and ensure it can scale with your business growth without becoming prohibitively expensive.
What's the difference between AI Data Analytics and Data Visualization tools?

The primary difference is their core purpose. Data Visualization tools focus on presenting data in graphical formats (charts, dashboards) to help humans understand it. Their goal is clarity and communication. AI Data Analytics tools focus on interpreting data to automatically uncover insights. While analytics tools often include visualization features, their main strength is using algorithms to find patterns, make predictions, and generate insights that are not obvious from a simple chart. In short, visualization shows you 'what' happened, while analytics tells you 'why' it happened and 'what' might happen next.

Who should use AI Data Analytics tools?

These tools are valuable for a wide range of professionals who need to make decisions based on data. Key users include:

  • Business Analysts: To understand market trends, track performance, and identify growth opportunities.
  • Marketing Teams: For customer segmentation, campaign optimization, and churn prediction.
  • Financial Analysts: To perform risk assessment, detect fraud, and forecast financial performance.
  • Operations Managers: For demand forecasting, supply chain optimization, and identifying process inefficiencies.

Essentially, anyone in a strategic role, from a department head to a C-level executive, can benefit from the actionable insights these tools provide.

Do I need to be a data scientist to use these tools?

Not necessarily. While data scientists can leverage advanced features for custom modeling, the industry has seen a rise in 'low-code' or 'no-code' platforms. These tools are specifically designed for business users, analysts, and managers. They often feature intuitive, drag-and-drop interfaces and automated machine learning (AutoML) capabilities that handle the complex statistical work behind the scenes. This democratization of data analytics allows non-technical professionals to generate powerful predictive insights by focusing on their business knowledge rather than on complex coding.