ToolMage
Sign in

Best 3 Observability AI tools for Productivity

Popular Observability AI tools in Productivity include Elastic, Langfuse, and ClickHouse, helping you work more efficiently.

Elastic
Freemium

Elastic

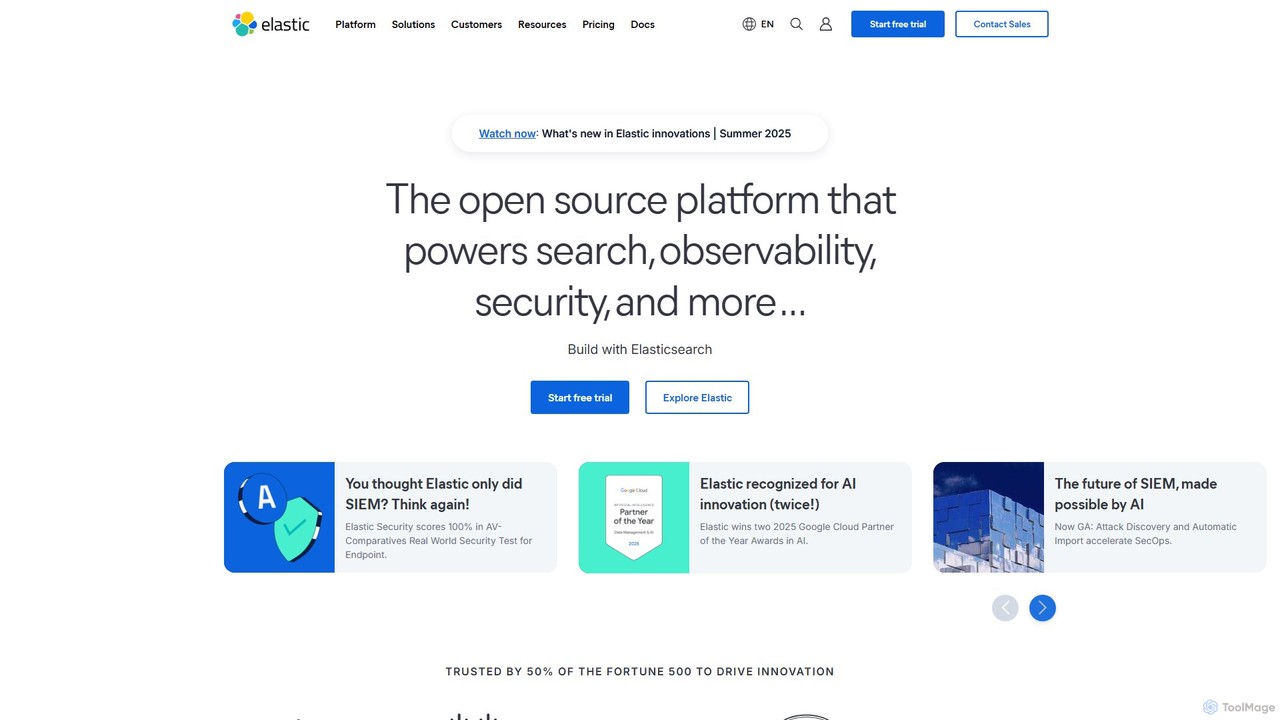
Elastic is a comprehensive Search AI platform built on Elasticsearch. It provides powerful solutions for enterprise search, observability, and security, integrating generative AI and a leading vector database to help organizations analyze data, monitor systems, and protect against threats in real-time.

Database
Visits 1.3MFavorites 134Likes 146
Langfuse
Freemium

Langfuse

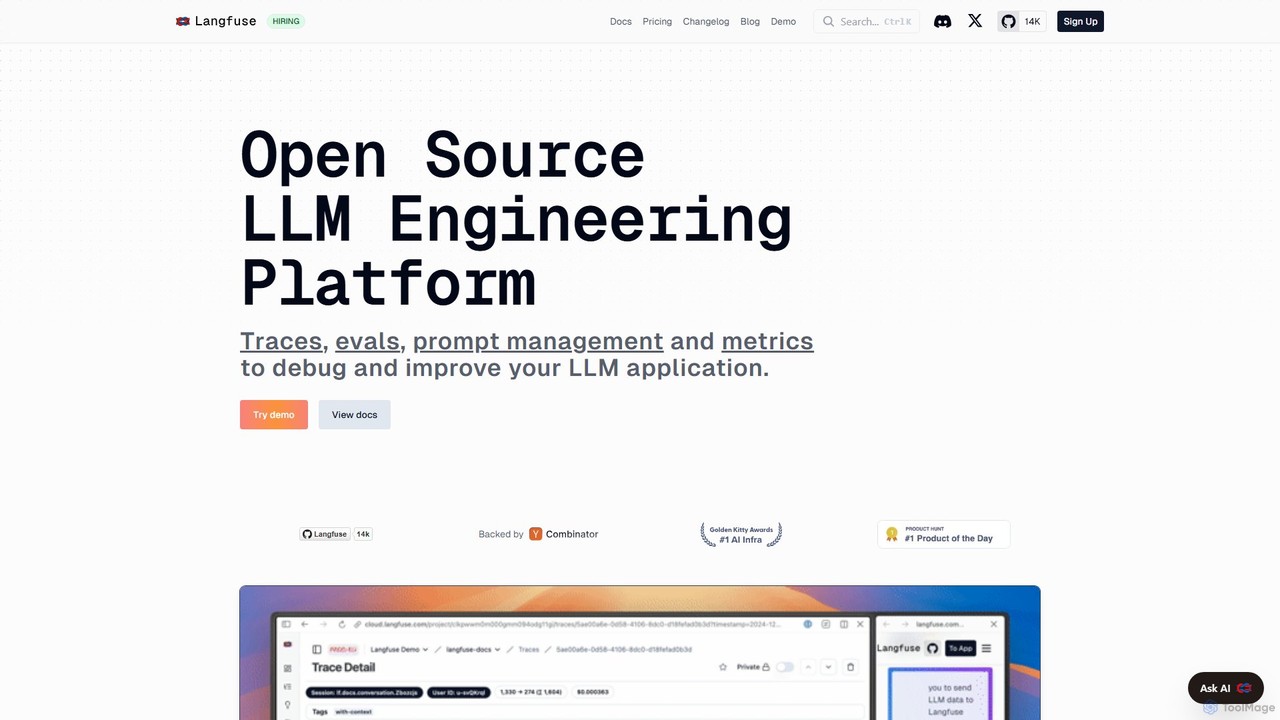
Langfuse is an open-source LLM engineering platform that provides comprehensive tools for debugging, evaluating, and improving LLM applications. It offers features like tracing, prompt management, evaluation frameworks, and metrics to streamline the entire development lifecycle for teams building with large language models.

Analytics
Visits 899.8KFavorites 102Likes 104
ClickHouse
Freemium

ClickHouse

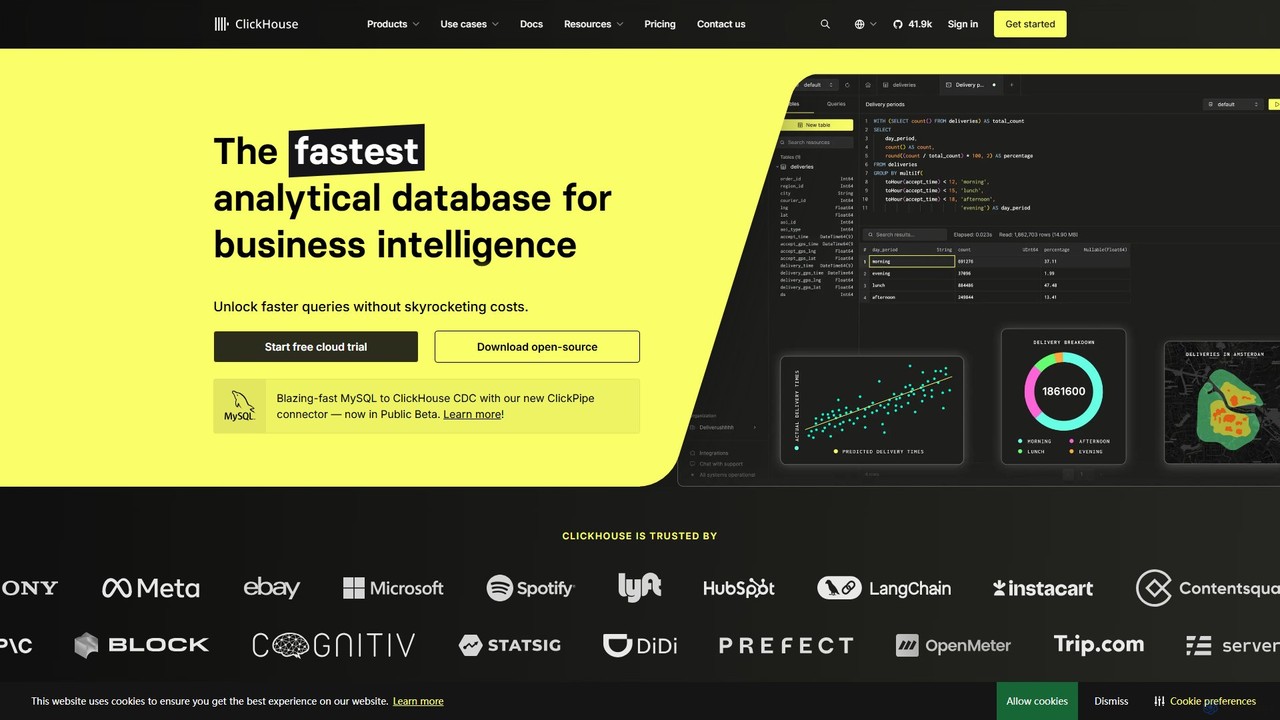
ClickHouse is a high-performance, open-source, column-oriented OLAP database management system. It's designed for real-time analytics on large-scale data, enabling blazing-fast queries for observability, business intelligence, ML/GenAI, and more, while remaining resource-efficient and cost-effective.

Databases
Visits 790.5KFavorites 109Likes 105

About Observability

AI Observability tools are a class of software that uses machine learning to analyze telemetry data—logs, metrics, and traces—from complex IT systems. They go beyond traditional monitoring by not just showing what is broken, but helping engineers understand why it broke. By automatically correlating vast amounts of data, these tools can proactively detect anomalies, predict potential failures, and accelerate root cause analysis. This capability is crucial for maintaining the reliability and performance of modern, distributed applications like microservices.

Core Features

  • Automated Anomaly Detection: Uses machine learning models to identify unusual patterns and deviations from normal system behavior in real-time.
  • AI-Powered Root Cause Analysis (RCA): Automatically correlates signals across logs, metrics, and traces to pinpoint the source of an issue, reducing manual investigation time.
  • Predictive Analytics: Forecasts future system states, such as resource saturation or performance degradation, enabling proactive intervention.
  • Intelligent Alerting: Reduces alert fatigue by grouping related notifications, suppressing noise, and prioritizing critical incidents based on impact.
  • Natural Language Querying: Allows engineers to ask complex questions about system performance using plain language, simplifying data exploration.

Use Cases

These tools are primarily used by Site Reliability Engineers (SREs), DevOps teams, and software developers responsible for operating complex, cloud-native applications. They are essential in industries like e-commerce, finance, SaaS, and gaming, where system uptime and performance directly impact revenue and user experience. Common scenarios include debugging microservices, preventing outages, and optimizing cloud resource usage.

How to Choose

When selecting an AI Observability tool, consider its integration capabilities with your existing tech stack (e.g., Kubernetes, serverless, specific databases). Evaluate the sophistication of its AI/ML models for anomaly detection and RCA. Assess its scalability to handle your data volume and the intuitiveness of its user interface for dashboards and querying. Finally, consider the pricing model, whether it's based on data ingestion, hosts, or users.

Featured tool rankings

Observability use cases

1

Proactive E-commerce Outage Prevention

An SRE team at a large e-commerce company uses an AI Observability tool to monitor their platform during a major sales event. The tool's machine learning model, trained on historical performance data, detects a subtle but growing latency in database queries that traditional threshold-based alerts would miss. It correlates this with a specific microservice handling checkout. The system proactively alerts the team, predicting a potential database overload in 30 minutes. This allows engineers to scale the database resources ahead of time, preventing a site-wide slowdown and protecting millions in revenue.

2

Accelerating Microservices Debugging

A developer is tasked with fixing a slow API endpoint in a complex microservices architecture. Instead of manually checking logs from dozens of services, they use an AI Observability platform. The platform automatically generates a distributed trace for the slow request, visualizing its path across all services. The AI component highlights a specific database query within one service as the primary bottleneck, showing it has an unusually high execution time. The developer can immediately focus on optimizing that single query, reducing the debugging time from hours to minutes.

3

Automating IT Operations Incident Response

An IT Operations team manages a hybrid cloud environment. A critical application fails, and previously, this would trigger hundreds of individual alerts from servers, networks, and databases, creating an 'alert storm'. With an AI Observability tool, the system ingests all these signals and uses its AI engine to correlate them. It generates a single, high-level incident report that identifies the root cause: a misconfigured network switch. The report includes context, such as the services impacted and a timeline of events, allowing the team to resolve the issue 90% faster and reducing Mean Time to Resolution (MTTR).

4

Optimizing Cloud Cost Management

A FinOps team is tasked with reducing a company's monthly cloud bill. They use an AI Observability tool that analyzes resource utilization metrics (CPU, memory) alongside application performance data. The AI identifies several Kubernetes clusters that are consistently over-provisioned, running at only 30% capacity even during peak hours. It also flags idle resources, like unattached storage volumes. Based on these actionable insights, the team confidently downsizes the clusters and decommissions unused resources, resulting in a 25% reduction in cloud spending without impacting application performance.

5

Improving Mobile App User Experience

A mobile development team notices a spike in negative app store reviews mentioning crashes. Using an AI Observability tool, they correlate crash reports (logs) with performance data (traces) from user sessions. The AI engine discovers a pattern: the crashes predominantly occur on older phone models when a new photo filter feature is used. The distributed trace for these sessions reveals excessive CPU and memory consumption from the filter's rendering process. This insight allows the team to release a targeted patch that optimizes the feature for low-spec devices, quickly improving user satisfaction and app ratings.

6

Securing Cloud-Native Applications

A security team uses an AI Observability platform as part of their threat detection strategy. The tool's AI continuously baselines normal application behavior, including API call patterns and data access frequencies. One day, it detects a highly anomalous sequence of API calls originating from a compromised user account, indicative of a data exfiltration attempt. Unlike traditional security tools that rely on known signatures, this behavior-based detection flags the novel attack pattern in real-time. The system automatically alerts the security team, providing the full context of the suspicious activity, enabling them to lock the account and prevent a data breach.

Observability FAQ

What are AI Observability tools?

AI Observability tools are advanced software platforms that use machine learning to analyze telemetry data (logs, metrics, traces) from IT systems. Unlike traditional monitoring which tracks predefined metrics, AI observability aims to understand the internal state of a system and uncover 'unknown unknowns'. They automate the process of detecting anomalies, correlating events to find the root cause of problems, and predicting future issues. This helps DevOps and SRE teams manage the complexity of modern applications, like microservices, more effectively.

How do Observability tools differ from traditional Monitoring tools?

The key difference lies in intent and capability. Traditional monitoring tells you when something is wrong by tracking known metrics against predefined thresholds (e.g., CPU usage is over 90%). Observability, on the other hand, helps you understand why something is wrong, especially for novel or unforeseen issues. It allows you to ask new questions of your system's data without needing to define the metric beforehand. While monitoring is about watching for known failure modes, observability is about having the data and tools to debug any failure mode, known or unknown.

Who should use AI Observability platforms?

AI Observability platforms are most beneficial for technical teams responsible for the performance and reliability of complex software systems. Key users include:

  • Site Reliability Engineers (SREs): For proactive issue detection, managing service level objectives (SLOs), and automating incident response.
  • DevOps Teams: To gain visibility across the entire software development lifecycle, from CI/CD pipelines to production environments.
  • Software Developers: For faster debugging and understanding the performance impact of their code in production.
  • IT Operations (ITOps): To manage hybrid and multi-cloud environments, reduce alert noise, and accelerate root cause analysis.
Essentially, any organization running distributed systems like microservices, Kubernetes, or serverless architectures will find significant value in these tools.

What are the key features to look for in an AI Observability tool?

When evaluating an AI Observability tool, focus on these core features:

  • Unified Data Platform: The ability to ingest and correlate all three pillars of observability—metrics, logs, and traces—in one place.
  • Automated Root Cause Analysis: AI-driven features that automatically identify the source of a problem without extensive manual queries.
  • Real-time Anomaly Detection: Machine learning models that can detect deviations from normal behavior across thousands of metrics instantly.
  • Broad Integration Support: Out-of-the-box integrations for your entire tech stack, including cloud providers, container orchestrators, databases, and application frameworks.
  • Scalability and Performance: The platform must be able to handle your current and future data volume without becoming slow or prohibitively expensive.

How does AI enhance system observability?

AI fundamentally enhances observability by automating the analysis of massive, complex datasets that are beyond human scale to process. It adds a layer of intelligence on top of raw telemetry data. Key enhancements include:

  • Pattern Recognition: AI can identify subtle patterns and correlations across millions of data points that signal an impending issue, which a human operator would likely miss.
  • Noise Reduction: It intelligently groups related alerts and filters out insignificant noise, allowing teams to focus on what truly matters.
  • Predictive Insights: By learning from historical data, AI models can forecast future problems, such as capacity shortages or performance bottlenecks, enabling proactive rather than reactive responses.
  • Faster Troubleshooting: AI automates the hypothesis-testing process of debugging by suggesting the most likely root causes, drastically reducing Mean Time to Resolution (MTTR).