ToolMage
Sign in

Best 4 Observability AI tools for It

Popular Observability AI tools in It include Resolve.ai, Digma, Incerto, and Anomify, helping you work more efficiently.

Anomify
Freemium

Anomify

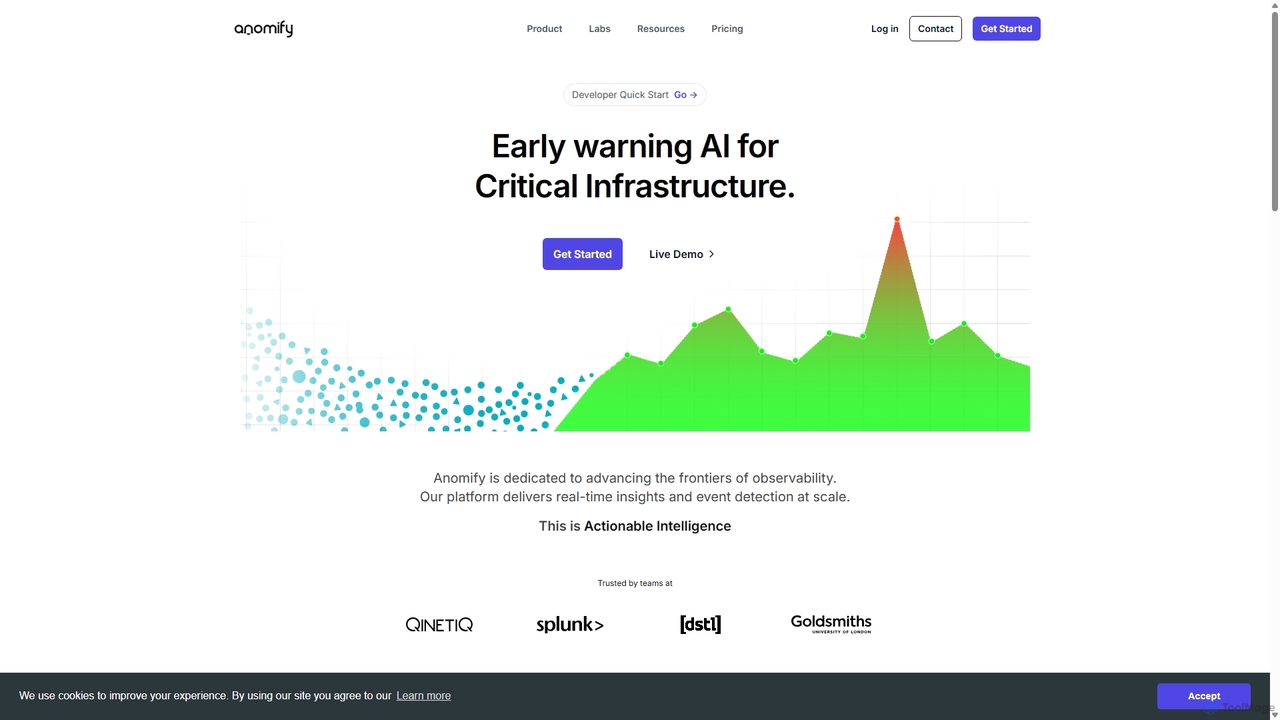
Anomify is an AI-powered early warning platform for critical infrastructure, offering real-time anomaly detection and observability at scale. It leverages multi-stage machine learning to analyze time-series data, significantly reduce false positives, and accelerate root cause analysis. Designed for DevOps, SREs, and IT teams, Anomify transforms monitoring from reactive to proactive, ensuring system performance and reliability.

Anomaly Detection
Visits 4.9KFavorites 116Likes 112
Digma
Freemium

Digma

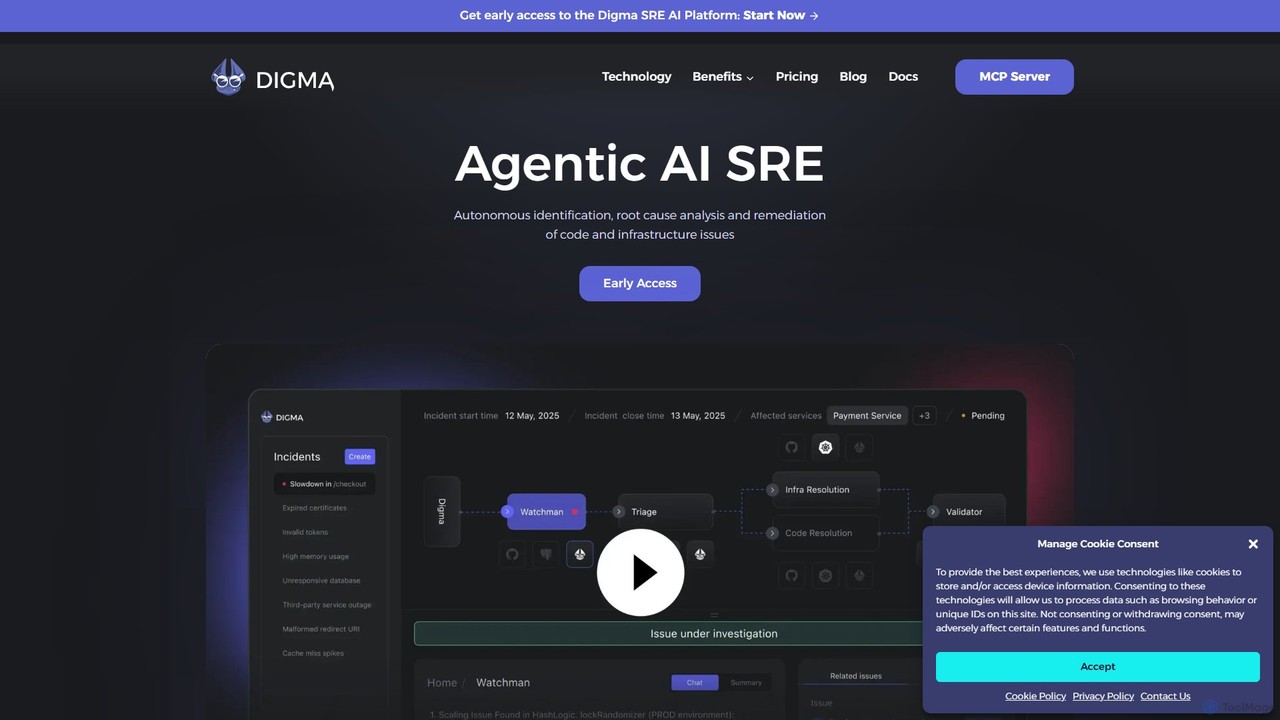
Digma is an agentic AI SRE platform that uses Dynamic Code Analysis (DCA) to autonomously identify, analyze, and remediate code and infrastructure issues before they reach production. It integrates with your observability stack to provide real-time insights, prevent breaking changes, and optimize application performance, significantly reducing resolution time and engineering effort.

Code Quality
Visits 16KFavorites 110Likes 118
Incerto
Freemium

Incerto

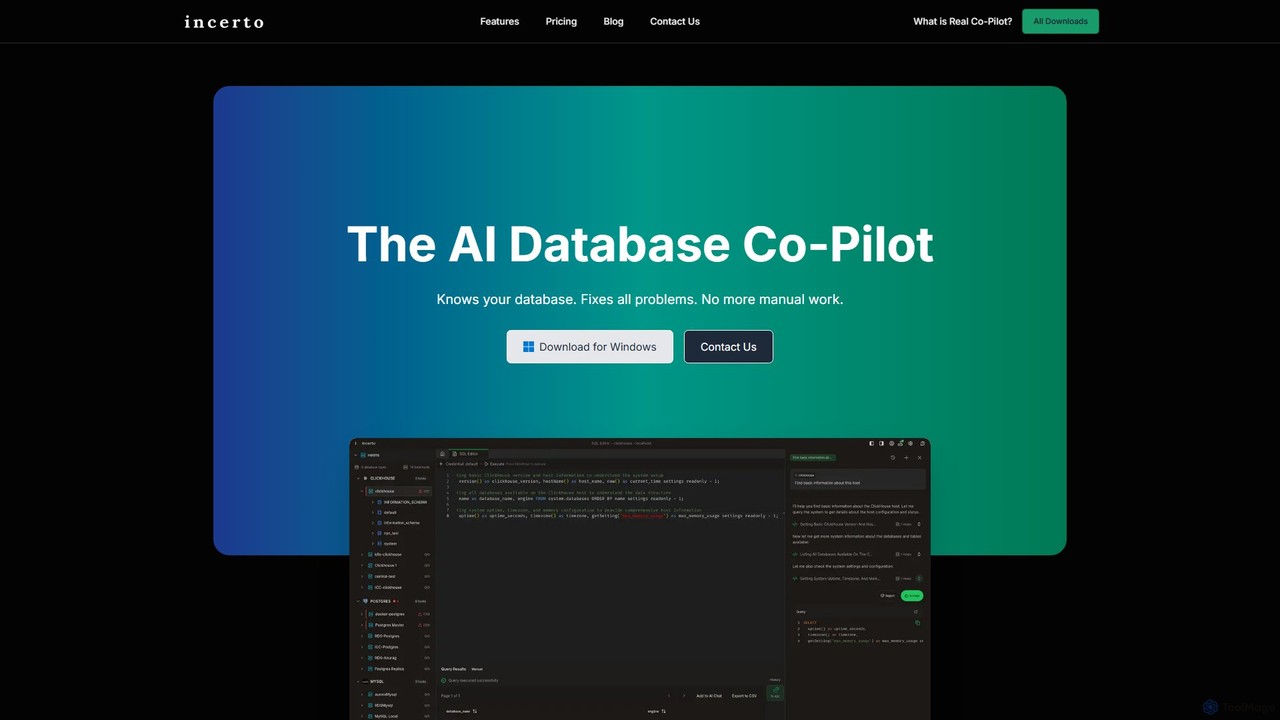
Incerto is an agentic AI co-pilot designed to solve all database problems. It proactively detects and resolves production issues, optimizes query performance, and automates complex database management tasks. By leveraging a rich context engine and specialized AI agents, Incerto significantly reduces manual work, minimizes downtime, and enhances overall database efficiency and security for developers and DBAs.

Database
Visits 5.2KFavorites 75Likes 96
Resolve.ai
Paid

Resolve.ai

Resolve.ai is an Agentic AI SRE platform that automates incident response and root cause analysis. It acts as a virtual team member on-call, investigating alerts, testing hypotheses, and identifying issues in minutes to reduce MTTR, decrease engineer burnout, and increase system uptime.

Incident Management
Visits 87.4KFavorites 166Likes 149

About Observability

Observability tools are advanced platforms designed to provide deep, queryable insights into the internal state of complex IT systems. They work by collecting, correlating, and analyzing high-cardinality telemetry data—primarily logs, metrics, and traces. This allows engineering teams to move beyond simple monitoring to actively explore and understand system behavior, making it possible to debug novel problems in distributed environments. These tools are crucial for maintaining the reliability and performance of modern cloud-native applications.

Core Features

  • Unified Telemetry Data: Ingests and correlates the three pillars of observability: logs, metrics, and distributed traces in a single platform.
  • Distributed Tracing: Visualizes the end-to-end journey of requests as they travel across multiple microservices and components.
  • High-Cardinality Analytics: Enables querying and filtering data based on arbitrary attributes, essential for debugging specific user sessions or requests.
  • AI-Powered Anomaly Detection: Automatically identifies unusual patterns or deviations from baseline performance without pre-configured rules.
  • Service Dependency Mapping: Generates real-time maps of how different services and infrastructure components interact with each other.

Use Cases

Observability tools are primarily used by DevOps engineers, Site Reliability Engineers (SREs), and software developers working on complex, distributed systems. They are essential for troubleshooting production incidents in microservices architectures, optimizing application performance by identifying bottlenecks, and understanding the impact of new code deployments in real-time. These platforms are also valuable for cloud infrastructure management and security analysis.

How to Choose

When selecting an Observability tool, consider its data source compatibility and the breadth of its integrations. Evaluate the power and usability of its query language for exploring data. Assess its scalability to handle your data volume and its pricing model (e.g., per-host, per-GB ingested). Finally, consider the effectiveness of its visualization tools, dashboards, and AI-driven alerting capabilities for your team's workflow.

Featured tool rankings

Observability use cases

1

Debug Microservice Failures in Production

A Site Reliability Engineer (SRE) receives an alert for high error rates in the checkout service. Using an observability platform, they access the distributed trace for a failed transaction. The trace visualizes the request's path across the authentication, inventory, and payment microservices. They quickly identify that the payment service is timing out when calling a third-party API. By inspecting the logs associated with that specific trace ID, they find the exact error message, enabling them to resolve the issue in minutes instead of hours.

2

Proactively Optimize Application Performance

A DevOps team notices a gradual increase in API response times. They use an observability tool to analyze metrics from their application servers, databases, and caches. By creating a dashboard that correlates CPU usage, database query latency, and cache hit rates, they discover a specific database query that has become inefficient as data has grown. The distributed tracing feature confirms this query is the primary bottleneck. The team optimizes the query and deploys the fix, successfully reducing the average API response time by 40% before it impacts end-users.

3

Understand the Impact of New Code Deployments

A software developer deploys a new feature that refactors a core part of the application. Immediately after deployment, they use an observability platform to compare key business metrics (like user sign-ups) and performance metrics (like latency and error rates) before and after the change. The platform's dashboards show a slight increase in latency but a significant drop in memory usage. This data-driven approach allows the team to validate that the refactoring was successful and had the intended positive impact on resource consumption without negatively affecting the user experience.

4

Monitor Cloud Resource Utilization and Costs

A cloud engineer is tasked with optimizing infrastructure costs. They use an observability tool to collect detailed metrics from their Kubernetes cluster, including CPU/memory usage per pod, network traffic, and persistent volume claims. By visualizing this data, they identify several over-provisioned services that consistently use less than 20% of their allocated resources. They also spot a memory leak in a specific application container. Based on these insights, they adjust the resource requests and limits for the services and fix the leak, resulting in a 25% reduction in their monthly cloud bill.

5

Correlate System Health with Business KPIs

A product manager for an e-commerce site wants to understand why cart abandonment rates are high. Using an observability tool that integrates with business analytics, they create a dashboard overlaying technical metrics (page load time, API errors) with business metrics (items added to cart, checkout completions). They discover a strong correlation: whenever the 'payment processing' API latency exceeds 2 seconds, the cart abandonment rate spikes by 50%. This direct link between technical performance and business outcomes provides clear justification for prioritizing engineering resources to optimize the payment API.

6

Enhance Security with Anomaly Detection

A security operations (SecOps) team uses an observability platform to ingest authentication logs from all services. They configure an AI-powered monitor to detect anomalies in login patterns. The system automatically flags a sudden spike in failed login attempts from a previously unseen IP range, followed by a successful login. This triggers an immediate alert. The security analyst investigates the associated traces and logs, confirms it's a credential stuffing attack, and quickly blocks the malicious IP range and forces a password reset for the compromised account, preventing a larger breach.

Observability FAQ

What are AI Observability tools?

AI Observability tools are platforms that provide deep insights into the health and performance of complex IT systems. Unlike traditional monitoring, which tracks predefined metrics, observability allows you to ask new questions about your system's behavior using rich data from logs, metrics, and traces. The 'AI' component enhances this by automatically detecting anomalies, predicting failures, and identifying root causes, helping teams solve unknown problems faster.

What's the difference between Observability and Monitoring?

Monitoring is about tracking the health of a system based on a predefined set of metrics and logs, answering known questions like 'Is the CPU usage high?'. Observability is the next step; it's about having enough data and tooling to explore your system and answer unknown questions, such as 'Why is the application slow only for users in a specific region?'. In short:

  • Monitoring tells you when something is wrong.
  • Observability helps you understand why it's wrong.
Observability is crucial for complex, distributed systems where failures can be unpredictable.

What are the three pillars of Observability?

The three pillars of observability are the primary types of telemetry data used to understand a system's state. They are:

  • Logs: Timestamped, unstructured or structured text records of discrete events. They are useful for understanding the specifics of what happened at a certain point in time.
  • Metrics: Numerical measurements aggregated over a period of time, like CPU usage percentage or request count per second. They are good for dashboards and alerting on trends.
  • Traces (or Distributed Traces): A representation of the entire journey of a single request as it moves through all the different services in an application. They are essential for debugging latency and errors in microservices architectures.

How do I choose the right Observability tool?

Choosing the right observability tool depends on your specific needs. Consider these factors:

  • Data Compatibility: Does the tool support the languages, frameworks, and infrastructure you use? Check for a wide range of integrations.
  • Scalability: Can the platform handle your current and future data volume without performance degradation or excessive cost?
  • Querying & Visualization: How easy is it to query your data and build meaningful dashboards? A powerful but intuitive query language is key.
  • Pricing Model: Understand the cost structure. Is it based on data ingestion, number of hosts, users, or a combination? Model your expected usage to avoid surprises.
  • AI & Automation: Evaluate the tool's AI capabilities for anomaly detection, root cause analysis, and intelligent alerting to reduce manual effort.

Who should use Observability tools?

Observability tools are most beneficial for technical teams responsible for building and maintaining modern software applications. Key users include:

  • DevOps Engineers and SREs: For maintaining system reliability, troubleshooting incidents, and managing infrastructure performance.
  • Software Developers: To understand how their code behaves in production, debug complex issues, and measure the impact of new features.
  • IT Operations Teams: For a deeper understanding of system health beyond traditional monitoring metrics.
  • Security Analysts: To analyze logs and traces for security threats and anomalous behavior.
Essentially, anyone who needs to answer 'why' something is happening within a complex IT environment can benefit from observability.