ToolMage
Sign in
Superjoin
Workflow · 41.4K monthly visits

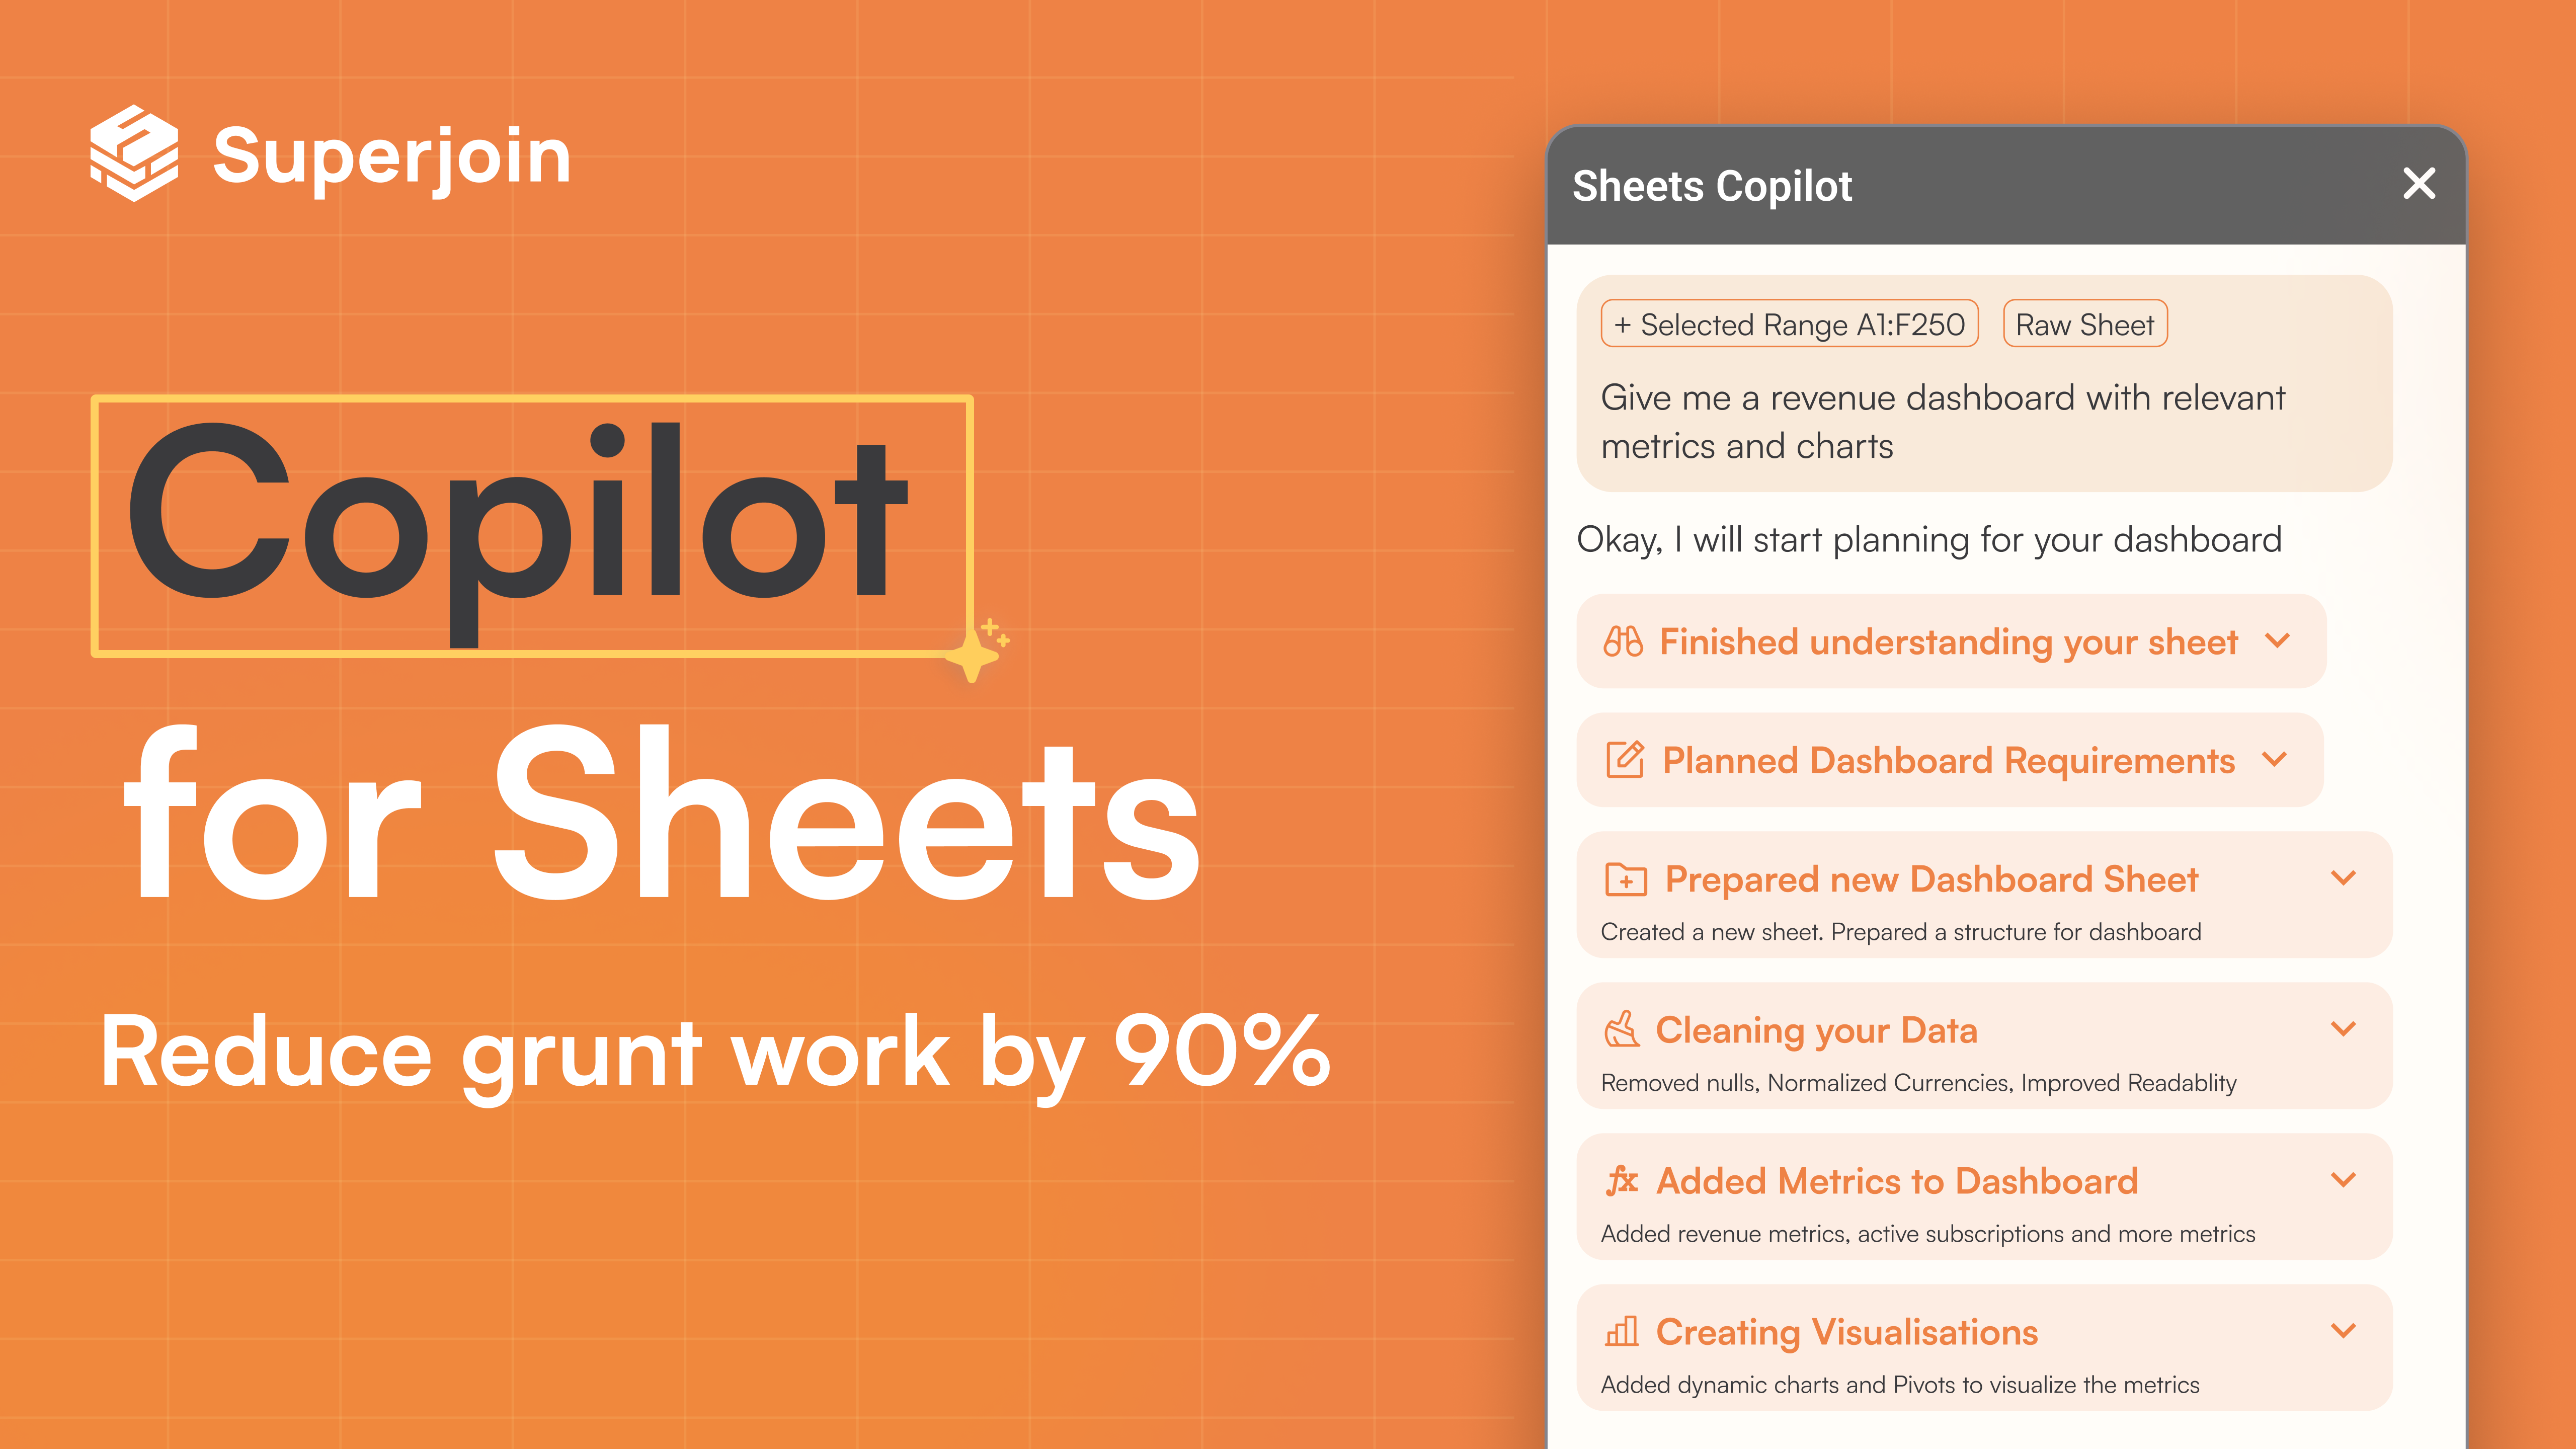
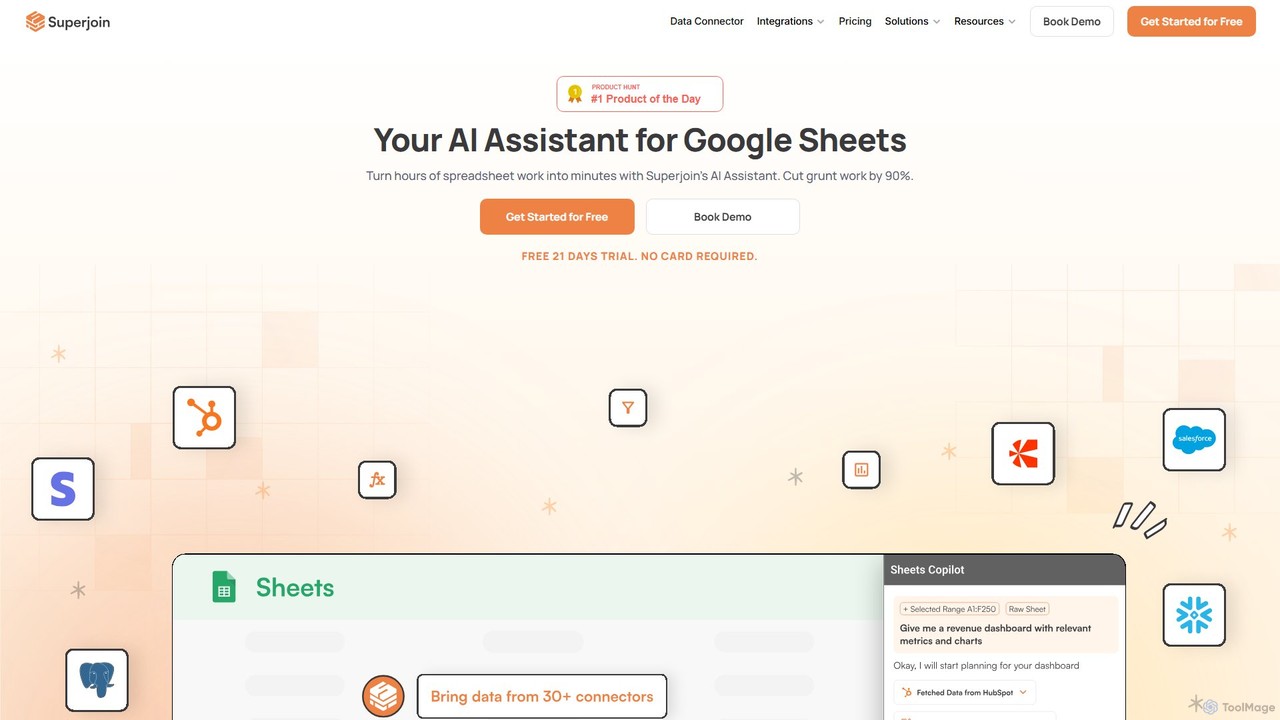
Superjoin is an AI assistant for Google Sheets designed to automate data tasks. It connects to over 30 data sources, allowing for automatic data pulls and refreshes. Users can leverage natural language to clean data, generate charts, create formulas, and build automated workflows, saving up to 90% of manual spreadsheet time.
VS
thebricks
Business Intelligence · 251.6K monthly visits

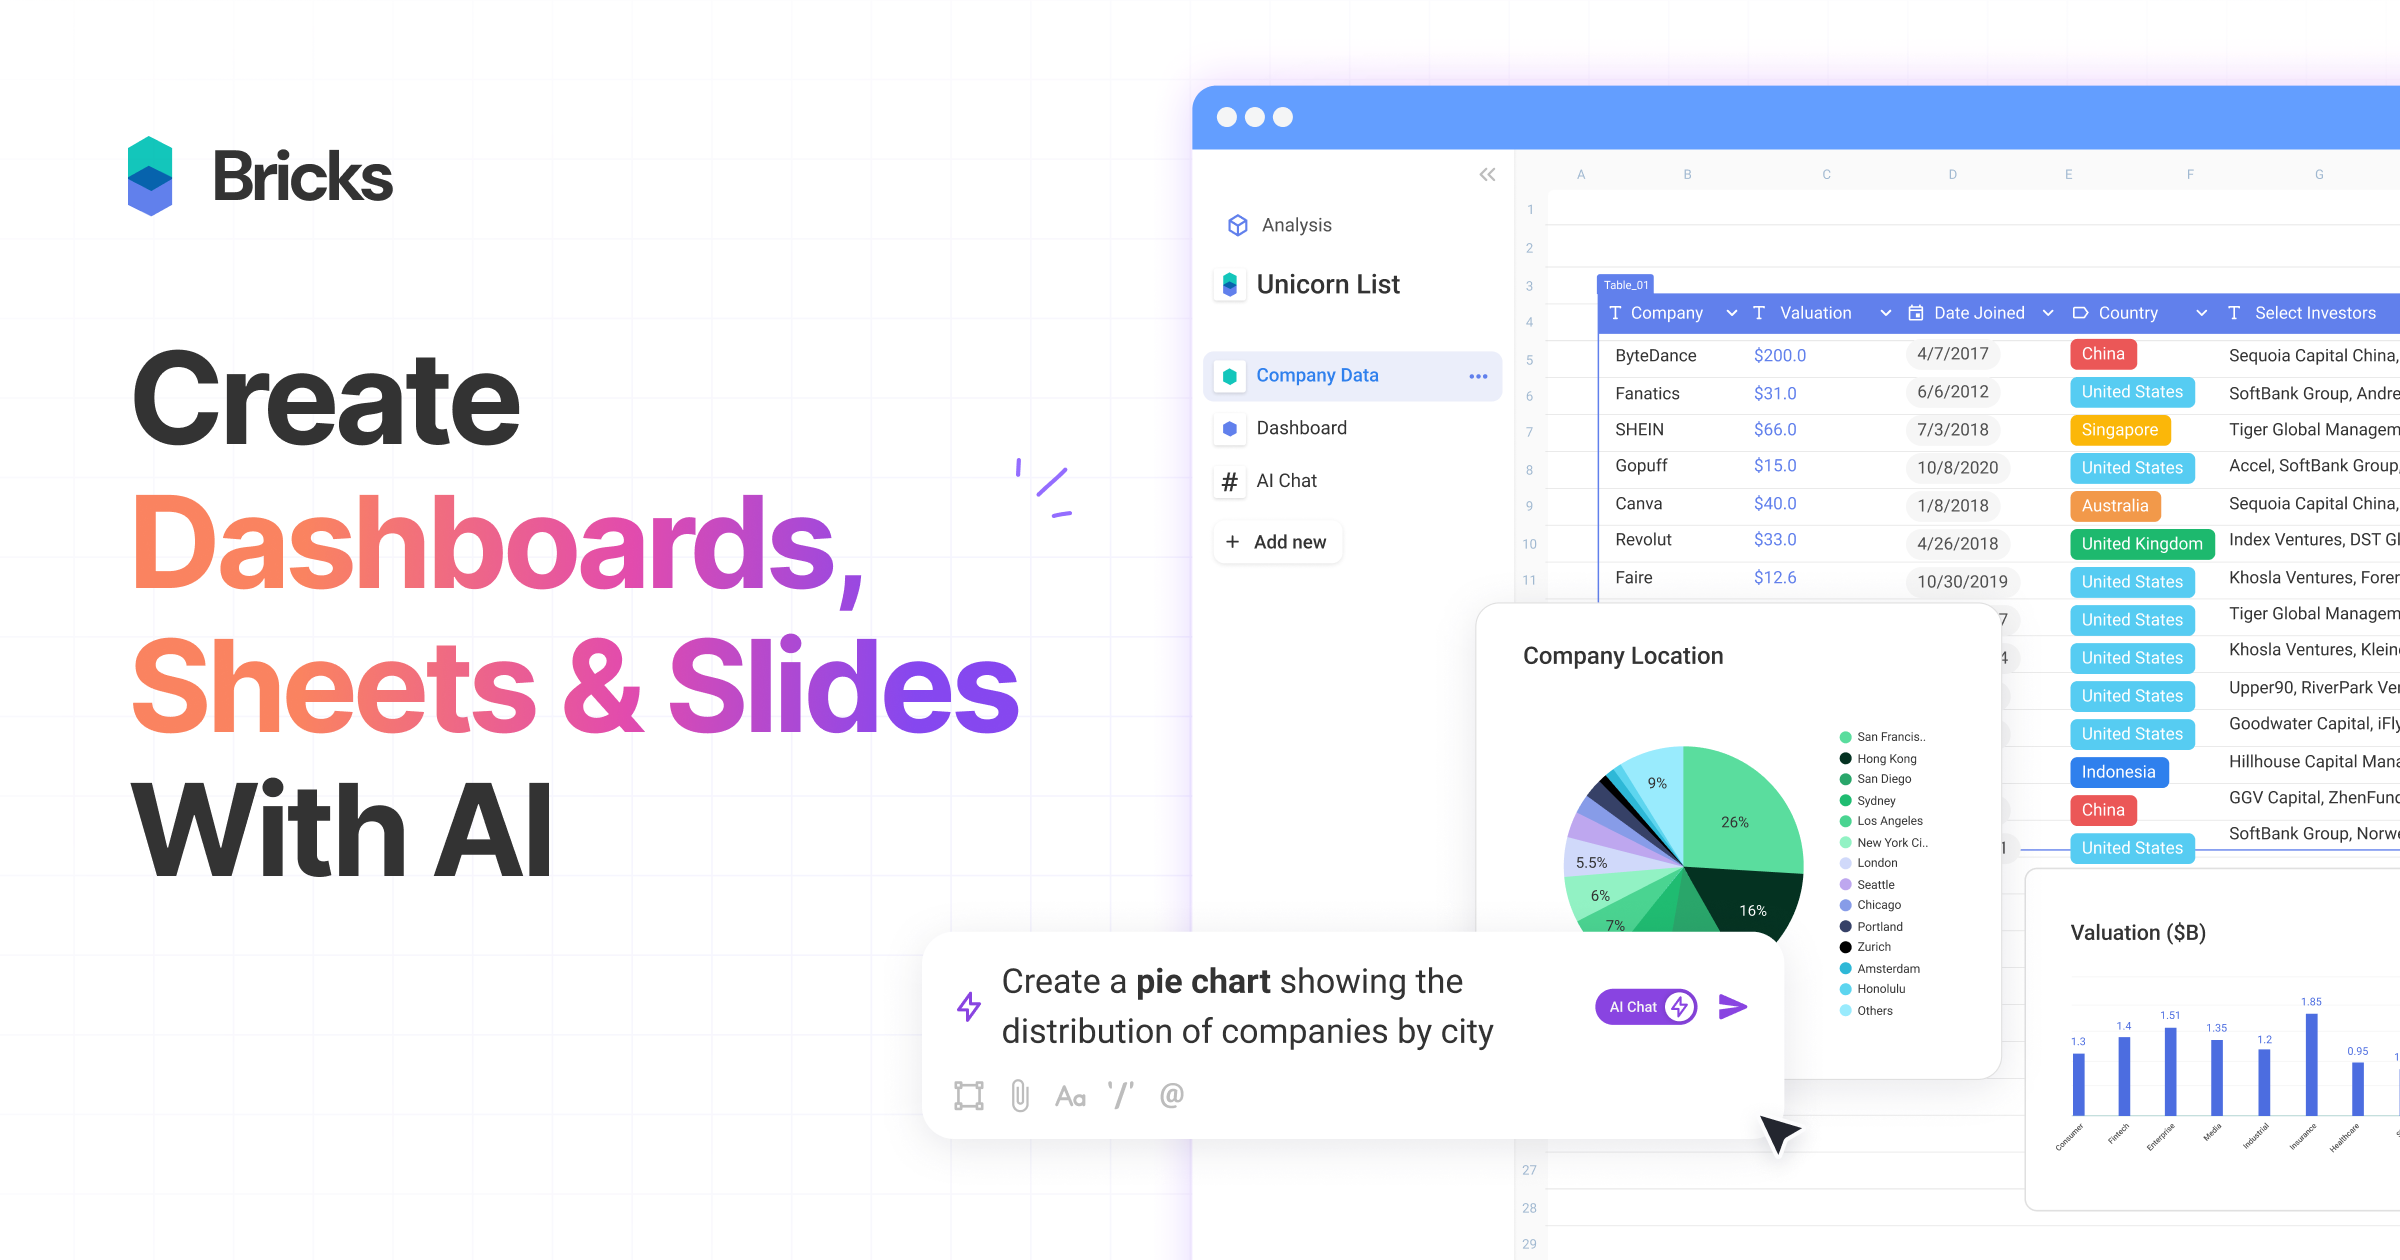
thebricks is an AI-powered workspace that transforms data analysis and reporting. It allows users to create interactive dashboards, dynamic spreadsheets, and professional slides using simple natural language prompts. Turn hours of manual work in Excel and PowerPoint into minutes, streamlining your workflow and boosting productivity.

Superjoin vs thebricks: pricing, features, traffic, and use cases

Compare Superjoin and thebricks across positioning, pricing, traffic, and user feedback using structured factual data.

Updated Aug 5, 2026

Product overview

Superjoin Product overview

Superjoin is an AI assistant for Google Sheets designed to automate data tasks. It connects to over 30 data sources, allowing for automatic data pulls and refreshes. Users can leverage natural language to clean data, generate charts, create formulas, and build automated workflows, saving up to 90% of manual spreadsheet time.

Preview

thebricks Product overview

thebricks is an AI-powered workspace that transforms data analysis and reporting. It allows users to create interactive dashboards, dynamic spreadsheets, and professional slides using simple natural language prompts. Turn hours of manual work in Excel and PowerPoint into minutes, streamlining your workflow and boosting productivity.

Preview

Detailed feature comparison

FeatureSuperjointhebricks
Primary categoryWorkflowBusiness Intelligence
Added2025-08-122025-08-11
PricingFreemiumFreemium
Official websitewww.superjoin.aiwww.thebricks.com
Product typeBrowser extensionWebsite
Performance data
User ratingNot verifiedNot verified
Comments00
Monthly visits41.4K251.6K
Monthly growth-1.1%-23.6%
Favorites102115
DetailsView detailsView details

Superjoin vs thebricks monthly traffic

Compare Superjoin and thebricks by monthly reach, traffic trend, visit depth, top regions, and acquisition sources.

How to interpret the traffic data

In the Superjoin vs thebricks monthly traffic comparison, Superjoin currently shows 41.4K visits and thebricks shows 251.6K; thebricks has about 6.1 times the visible traffic of Superjoin, an absolute difference of about 210.2K visits. This reflects visible reach, not feature quality or paid users.

Both tools provide verified traffic details, so monthly trends, visit depth, regions, and acquisition sources can be compared on the same basis.

Superjoin monthly traffic:

Latest traffic

Monthly visits
41.4K
Avg. visit duration
0:14
Pages per visit
1.47
Bounce rate
41.24%
Data updated 2026-06-15

Monthly traffic trend

  • 2025/9: 115K Monthly visits
  • 2026/1: 121.3K Monthly visits
  • 2026/2: 72.5K Monthly visits
  • 2026/3: 54.9K Monthly visits
  • 2026/4: 41.9K Monthly visits
  • 2026/5: 41.4K Monthly visits

Top regions

Top 5 countries/regions
Country/regionPercentageTraffic
🇮🇳India33.04%13.7K
🇺🇸United States32.46%13.4K
🇩🇪Germany15.42%6.4K
🇻🇳Vietnam10.31%4.3K
🇮🇩Indonesia8.77%3.6K

Search keywords

how to change column name excelsuper joinsuperjoinsuperjoin aiwhere is the collapse button for the rows in excel

thebricks monthly traffic:

Latest traffic

Monthly visits
251.6K
Avg. visit duration
3:30
Pages per visit
3.1
Bounce rate
48.17%
Data updated 2026-06-15

Monthly traffic trend

  • 2025/9: 706.4K Monthly visits
  • 2026/1: 493.4K Monthly visits
  • 2026/2: 382K Monthly visits
  • 2026/3: 414.7K Monthly visits
  • 2026/4: 329.3K Monthly visits
  • 2026/5: 251.6K Monthly visits

Top regions

Top 5 countries/regions
Country/regionPercentageTraffic
🇺🇸United States51.54%129.7K
🇨🇦Canada19.43%48.9K
🇮🇳India11.5%28.9K
🇬🇧United Kingdom10.12%25.5K
🇻🇳Vietnam7.41%18.6K

Traffic sources

Source typePercentageTraffic
Direct78.94%198.6K
Referral16.45%41.4K
Email4.61%11.6K

Search keywords

bricksbricks aiportrait spreadsheetremove extra enters in cell excelthebricks
Traffic-based selection guidance: If public market visibility is an important first-pass criterion, investigate thebricks first. The final choice should still follow taxonomy, use case, and a real trial because higher traffic does not prove broader capabilities or better workflow fit.

Usage comparison

Compare the core capabilities of Superjoin and thebricks

Superjoin Core features

Spreadsheets
Workflow

thebricks Core features

Spreadsheets
Business Intelligence
Data Visualization
Presentations

Use cases

Superjoin Use cases

AI assistant
business intelligence
data analysis
no-code
data connector
Google Sheets
report automation
spreadsheet automation
workflow automation

thebricks Use cases

AI assistant
business intelligence
data analysis
no-code
dashboard
data visualization
presentation
productivity
reporting
spreadsheet

Superjoin vs thebricks:In-depth comparison and selection guidance

First decide whether the products solve the same kind of need

This in-depth Superjoin vs thebricks comparison uses only the product records, taxonomy, audience, traffic, and community signals available on this page. Superjoin is primarily listed under “Workflow”, while thebricks is primarily listed under “Business Intelligence”, so the first decision is whether your actual task matches their recorded scope.

The structured fields currently show these decision-relevant differences: Primary category (Superjoin: Workflow; thebricks: Business Intelligence); Product type (Superjoin: Browser extension; thebricks: Website); Monthly visits (Superjoin: 41.4K; thebricks: 251.6K); Monthly growth (Superjoin: -1.1%; thebricks: -23.6%); Favorites (Superjoin: 102; thebricks: 115). These facts are more useful for selection than brand visibility alone.

What market visibility and monthly traffic mean

In the Superjoin vs thebricks monthly traffic comparison, Superjoin currently shows 41.4K visits and thebricks shows 251.6K; thebricks has about 6.1 times the visible traffic of Superjoin, an absolute difference of about 210.2K visits. This reflects visible reach, not feature quality or paid users.

Both tools provide verified traffic details, so monthly trends, visit depth, regions, and acquisition sources can be compared on the same basis.

If public market visibility is an important first-pass criterion, investigate thebricks first. The final choice should still follow taxonomy, use case, and a real trial because higher traffic does not prove broader capabilities or better workflow fit.

Product positioning, use cases, and roles

Superjoin and thebricks currently overlap in shared categories: Spreadsheets; shared tags: AI assistant, business intelligence, data analysis, and no-code. This can place both on the same shortlist, but it does not prove equal implementation, depth, or cost.

Superjoin's unique categories/tags are Workflow, data connector, Google Sheets, report automation, spreadsheet automation, and workflow automation; thebricks's are Business Intelligence, Data Visualization, Presentations, dashboard, data visualization, presentation, productivity, and reporting. These unique fields are the strongest differentiators: validate the product whose recorded scope matches the task instead of following traffic alone.

What ratings, comments, and favorites can tell you

Superjoin has no verified rating, 0 comments, 102 favorites, and 95 likes;thebricks has no verified rating, 0 comments, 115 favorites, and 131 likes。

Neither product has enough rating or comment samples for a credible reputation ranking.

Selection guidance by actual need

When to evaluate Superjoin first

Put Superjoin on the priority trial list when the task aligns with “Workflow” and especially Workflow, data connector, Google Sheets, report automation, spreadsheet automation, and workflow automation. This follows recorded positioning and does not imply unlisted capabilities are absent.

Superjoin also currently records: pricing is freemium, product type is browser extension, 41.4K verified monthly visits, no verified user rating. Verify any hard requirement around price, platform, or reach before trial, and do not let sparse review data substitute for testing.

When to evaluate thebricks first

Put thebricks on the priority trial list when the task aligns with “Business Intelligence” and especially Business Intelligence, Data Visualization, Presentations, dashboard, data visualization, and presentation. This follows recorded positioning and does not imply unlisted capabilities are absent.

thebricks also currently records: pricing is freemium, product type is website, 251.6K verified monthly visits, no verified user rating. Verify any hard requirement around price, platform, or reach before trial, and do not let sparse review data substitute for testing.

How to validate the recommendation before deciding

The available data describes positioning, public visibility, and community signals, but it cannot prove output quality, speed, integration effort, privacy, or long-term cost in your workflow. Before deciding, run the same representative tasks in Superjoin and thebricks, then record completion time, accuracy, manual corrections, and the real paid threshold. A like-for-like trial turns this comparison into a defensible adoption decision.

Comparison FAQ

How should I choose between Superjoin and thebricks?
Compare positioning, pricing, taxonomy, and traffic maturity, then verify the latest details on each official website.
Where does this comparison data come from?
The factual baseline is derived from product, taxonomy, traffic, and community data. Reviewed editorial conclusions show their source and verification date.
What do unknown fields mean?
Unknown means there is not enough reliable evidence; the page does not fill gaps with assumptions.

Related AI tools

GRID
Freemium

GRID

GRID is an AI-first platform that transforms your existing spreadsheets into powerful, interactive web applications and AI-driven tools. It leverages the logic and data within your Excel and Google Sheets files to build reliable calculators, dashboards, and models that can be queried using natural language, eliminating AI hallucinations.

Business Intelligence
Visits 31.7KFavorites 124Likes 113
Ajelix
Freemium

Ajelix

Ajelix is an AI-powered suite of tools designed to enhance productivity for Excel and Google Sheets users. It acts as an AI data analyst, automating tasks, generating formulas and VBA scripts, creating insightful reports, and providing advanced data analysis through a simple chat interface.

Business Intelligence
Visits 103.7KFavorites 100Likes 94
Fabi.ai
Freemium

Fabi.ai

Fabi.ai is an AI-powered business intelligence and data analysis platform designed for lean teams. It integrates SQL, Python, and AI to help users build dashboards, automate workflows, and explore data 10x faster. The platform offers an all-in-one collaborative environment, reducing context switching and enabling both technical and non-technical users to derive insights from their data sources like data warehouses, Google Sheets, and more.

Business Intelligence
Visits 21.1KFavorites 87Likes 119
ChatExcel
Freemium

ChatExcel

ChatExcel is an AI-powered data analysis tool that allows users to process spreadsheets and analyze data through a simple chat interface. It automates tasks like data cleaning, merging, and analysis, and generates over 100 types of charts and visualizations from natural language commands. No coding or complex formulas required, boosting productivity by up to 90%.

Business Intelligence
Visits 320.7KFavorites 96Likes 103
excelmatic
Freemium

excelmatic

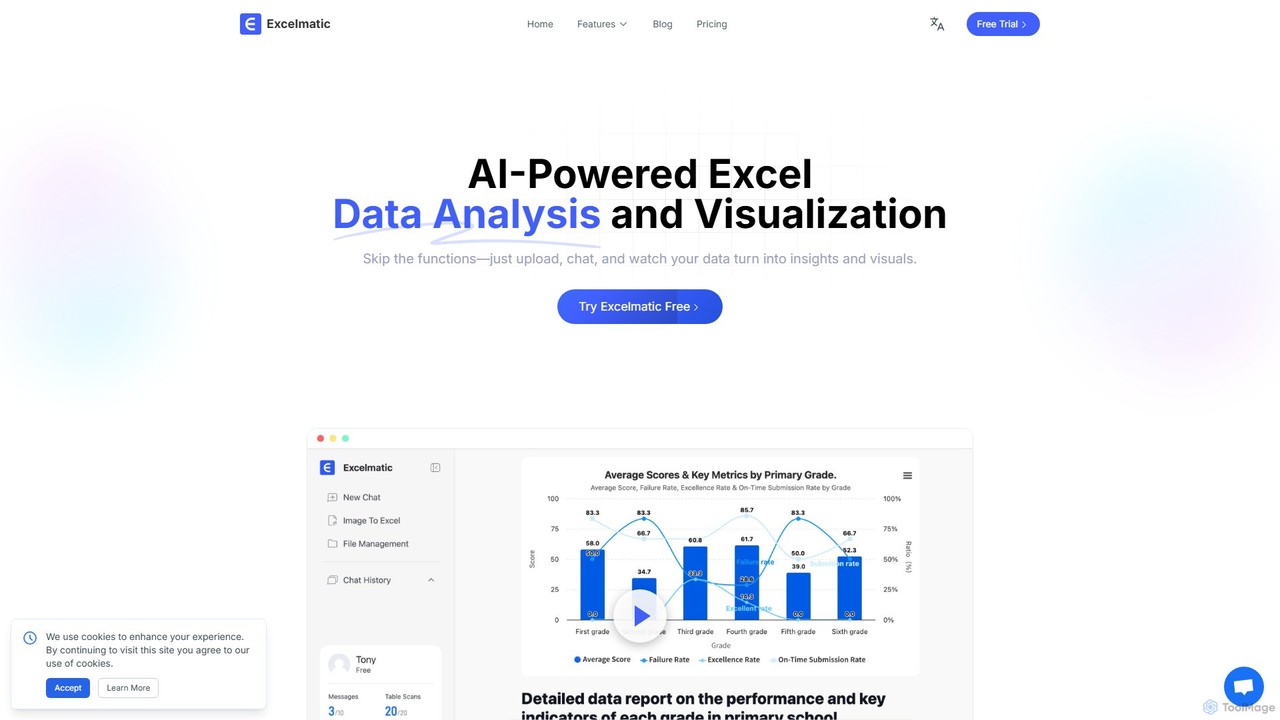
Excelmatic is an AI-powered assistant that transforms your Excel and spreadsheet tasks. Simply upload your data, ask questions in plain English, and instantly get data analysis, visualizations, and generated formulas. It's a no-code solution designed to automate data cleaning, chart creation, and insight discovery, making data accessible to everyone.

Business Intelligence
Visits 66.4KFavorites 123Likes 108
Coefficient
Freemium

Coefficient

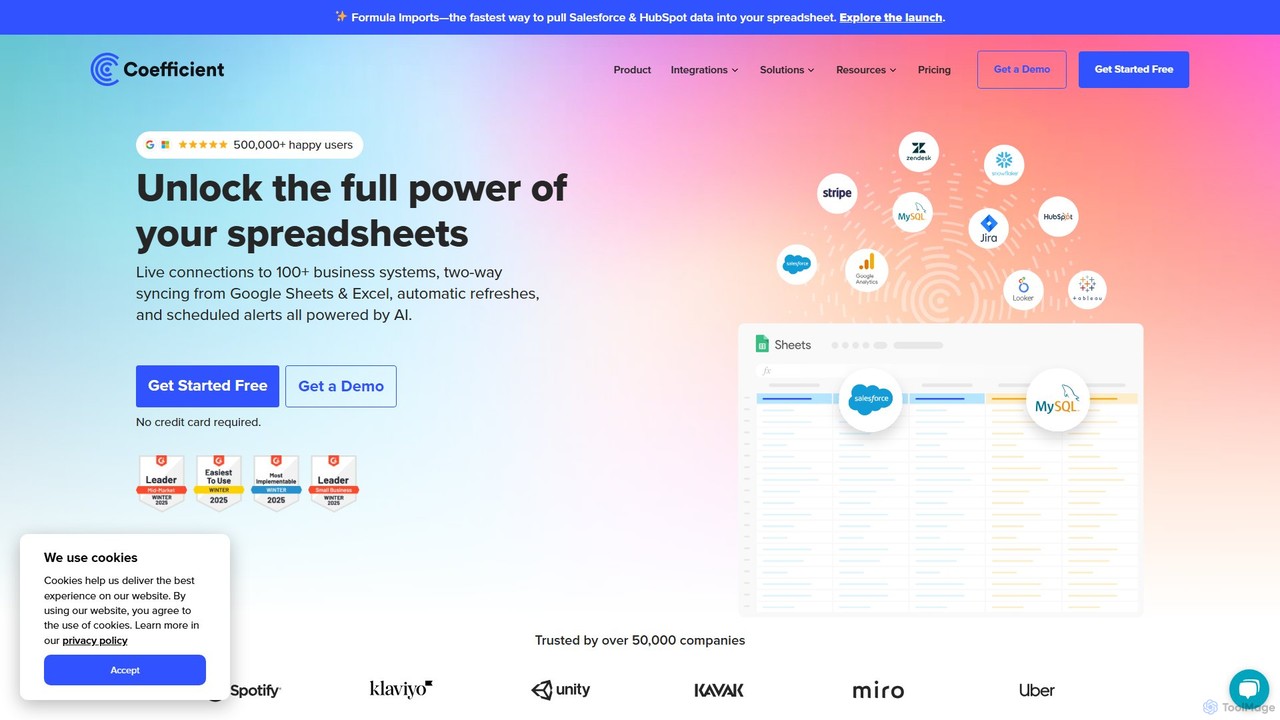
Coefficient is a data connector that links Google Sheets and Excel with over 100 business systems like Salesforce and HubSpot. It automates data imports, enables two-way syncing, and uses AI to help users build formulas, SQL queries, and charts, transforming static spreadsheets into dynamic, real-time dashboards.

Data Analysis
Visits 165.2KFavorites 90Likes 99
Sourcetable
Freemium

Sourcetable

Sourcetable is an AI-powered spreadsheet that combines the functionality of traditional spreadsheets with an AI data analyst. It allows users to connect to live data sources, ask questions in plain English, generate formulas, create charts, and automate reports. By integrating AI, Python, and SQL capabilities directly into the spreadsheet interface, Sourcetable empowers users of all skill levels to perform complex data analysis, cleaning, and visualization tasks effortlessly, turning raw data into actionable insights in seconds.

No Code
Visits 46.4KFavorites 118Likes 135
table.studio
Freemium

table.studio

table.studio is an AI-powered data workspace that combines the simplicity of a spreadsheet with the power of a database and AI. Use natural language to query, analyze, and visualize your data, automating tedious tasks and uncovering insights instantly. It's designed for teams to collaborate on data projects in real-time.

Database Management
Visits 21.7KFavorites 114Likes 131
ExcelFormulaBot
Freemium

ExcelFormulaBot

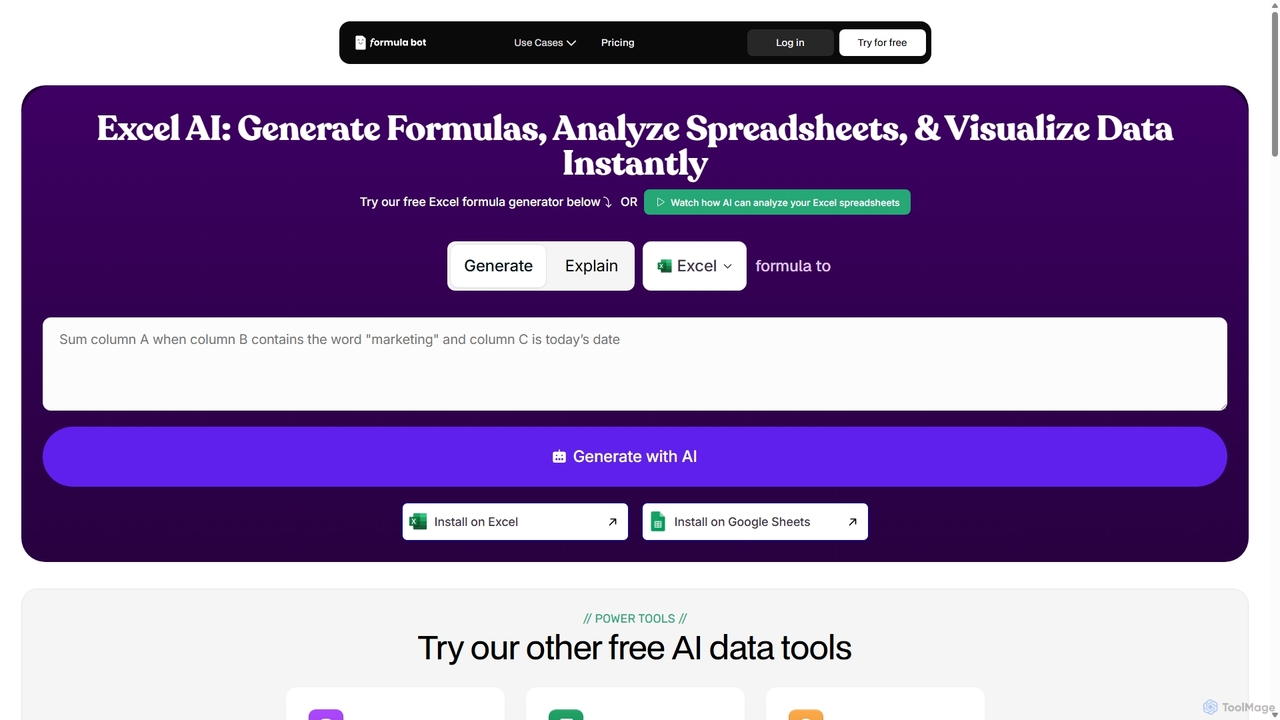
ExcelFormulaBot is an AI-powered tool that generates complex Excel and Google Sheets formulas from text instructions in seconds. It also analyzes data, creates charts, generates VBA/SQL code, and explains formulas, making spreadsheet tasks faster and more accessible for everyone, from beginners to experts.

Data Analysis
Visits 3.5KFavorites 113Likes 91
gptagent
Freemium

gptagent

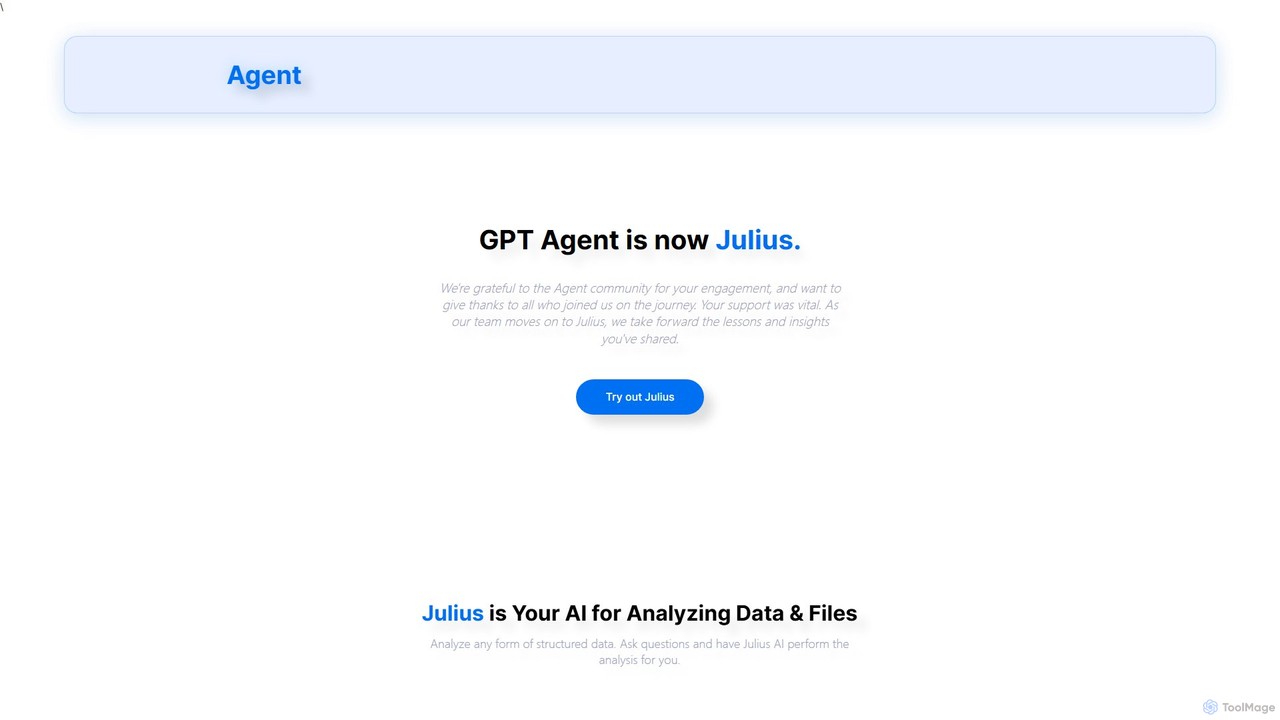
gptagent has rebranded to Julius, an AI data analyst that allows you to analyze data and files using natural language. Upload structured data, ask questions, and instantly generate visualizations, perform statistical analysis, and build models without writing any code. It transforms complex data tasks into simple conversations.

Business Intelligence
Visits 3.3KFavorites 128Likes 128
Definite
Freemium

Definite

Definite is an AI-powered, all-in-one data analytics platform that combines data integration, warehousing, and business intelligence. It enables teams to connect hundreds of data sources, ask questions in plain English, and build dashboards without engineering support, turning scattered data into actionable insights in minutes.

Business Intelligence
Visits 18.8KFavorites 112Likes 99
Lemonado
Freemium

Lemonado

Lemonado is an AI-powered data platform that connects to your real-time business data sources. It allows you to build interactive dashboards, chat with your data using a natural language AI assistant, and automate insights without writing any code. It's designed to help sales, customer success, and operations teams make faster, data-driven decisions by unifying all their information in one accessible place.

Business Intelligence
Visits 7.3KFavorites 153Likes 142
Airbook
Freemium

Airbook

Airbook is an AI-powered Go-to-Market (GTM) data platform that unifies data from CRM, marketing, finance, and product tools into a single collaborative workspace. It enables teams to analyze data using natural language, SQL, or a no-code builder, create dashboards, and activate insights to drive revenue growth.

Business Intelligence
Visits 5.5KFavorites 126Likes 121
SheetBot
Freemium

SheetBot

SheetBot is an AI-powered data analysis platform that enables users to analyze, visualize, and transform data without writing any code. Simply upload your dataset or connect a data source, ask questions in plain English, and receive instant insights, trends, and dynamic visualizations. Powered by advanced models like GPT-4o and Claude 3.5 Sonnet, it streamlines complex analyses, turning hours of work into minutes.

Business Intelligence
Visits 3.5KFavorites 122Likes 118
Flarelight
Freemium

Flarelight

Flarelight is an AI-powered, no-code business intelligence platform for data analysis and visualization. It allows users to import data from any source, prepare it visually, perform deep analysis, and build interactive reports. The all-in-one tool supports both cloud and on-premise deployment, featuring workflow automation and natural language configuration to turn complex data into actionable decisions.

No Code
Visits 3.4KFavorites 135Likes 131