ToolMage
Sign in

Best 296 Data Analysis AI tools for Productivity

Popular Data Analysis AI tools in Productivity include Alchemer, Tableau, Ansy.ai, HEROZ, SurveySparrow, Amplitude, Fiscal.ai, TrendSpider, EarningsHub, and danelfin, helping you work more efficiently.

S32
Freemium

S32

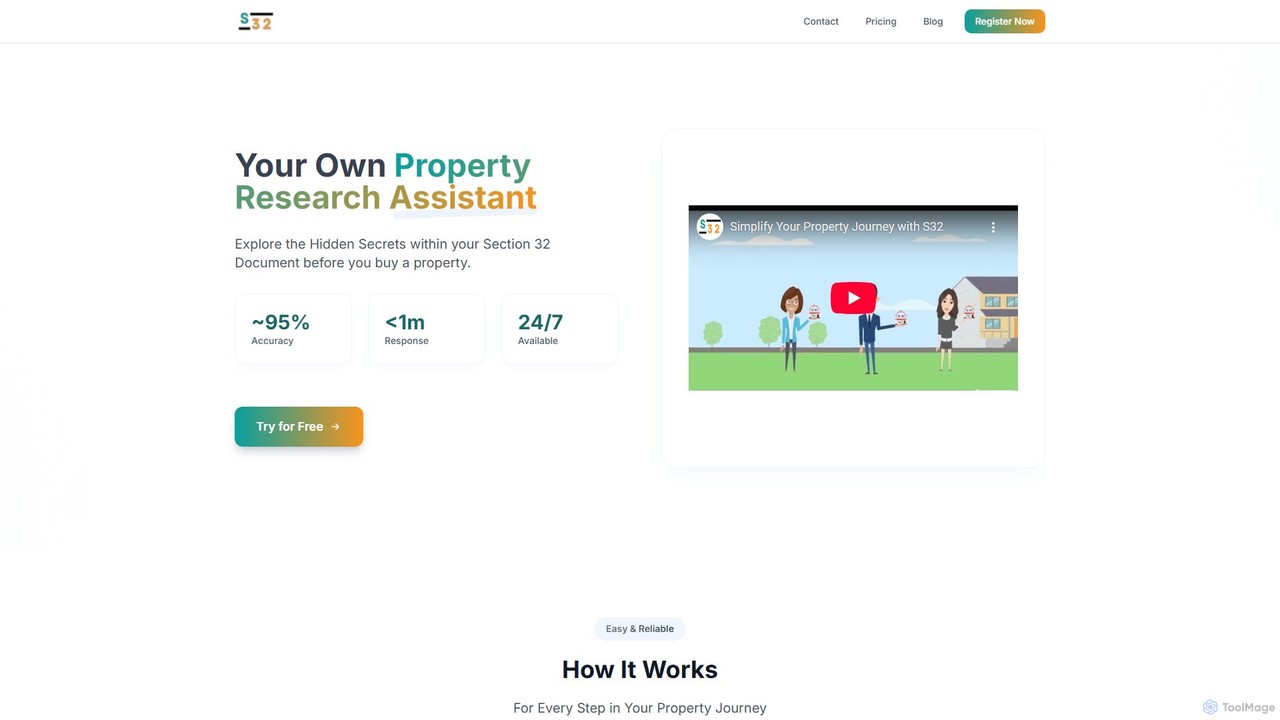
S32 is an AI-powered property research assistant for the Australian market. It specializes in analyzing complex legal documents like Section 32 statements and rental agreements. Users can upload documents to receive instant, comprehensive risk reports, uncovering hidden issues such as zoning restrictions, flood risks, and legalities. The AI chat feature allows users to ask questions in plain English, making property research faster, easier, and more accessible for homebuyers, investors, and real estate professionals.

Investment
Visits 5.4KFavorites 156Likes 162
anecdoteai
Freemium

anecdoteai

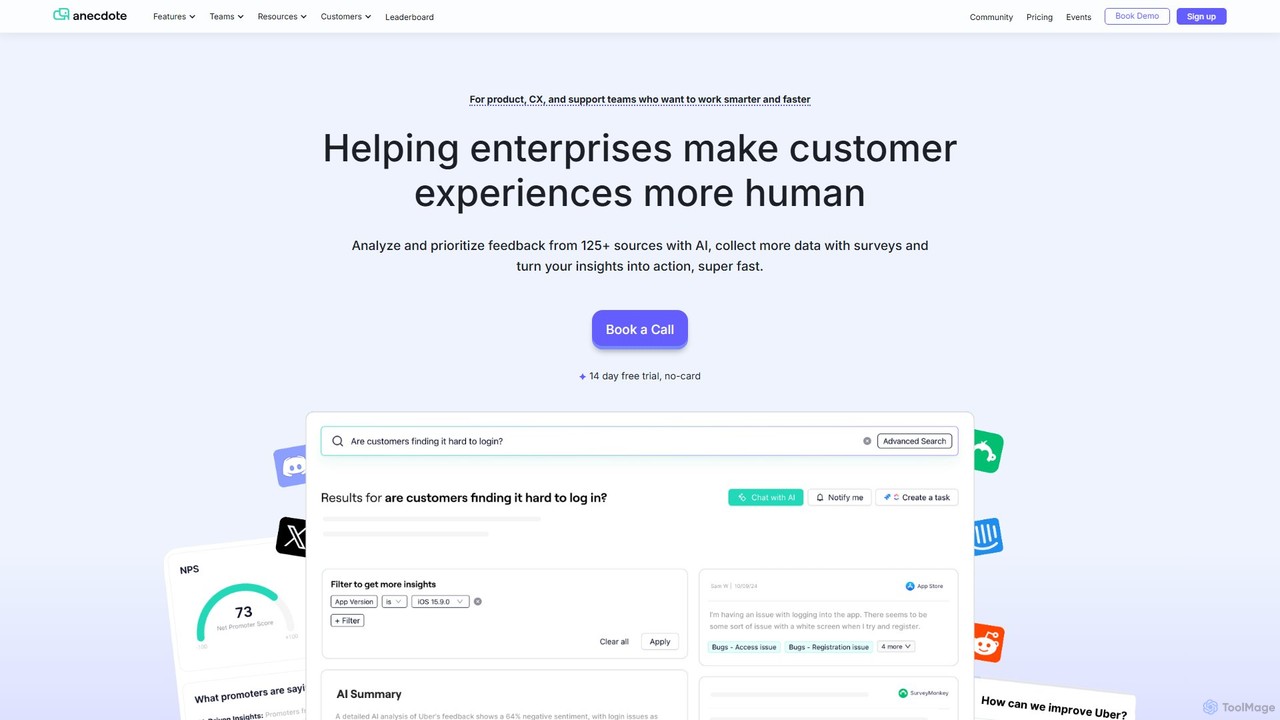
AnecdoteAI is an all-in-one customer experience (CX) platform that uses AI to analyze and prioritize feedback from over 125 sources. It helps product, CX, and support teams centralize feedback, uncover actionable insights, monitor competitors, and automate analysis to build more human customer experiences, faster.

Market Research
Visits 6.1KFavorites 122Likes 118
Gretel
Freemium

Gretel

Gretel is an advanced synthetic data platform designed for AI development. It enables developers and data scientists to generate high-fidelity, privacy-preserving artificial datasets that mimic real-world data. This allows for robust AI model training, testing, and data sharing without compromising sensitive information or violating privacy regulations like GDPR and CCPA.

Synthetic Data
Visits 9.7KFavorites 134Likes 133
ai_stock_predictions
Freemium

ai_stock_predictions

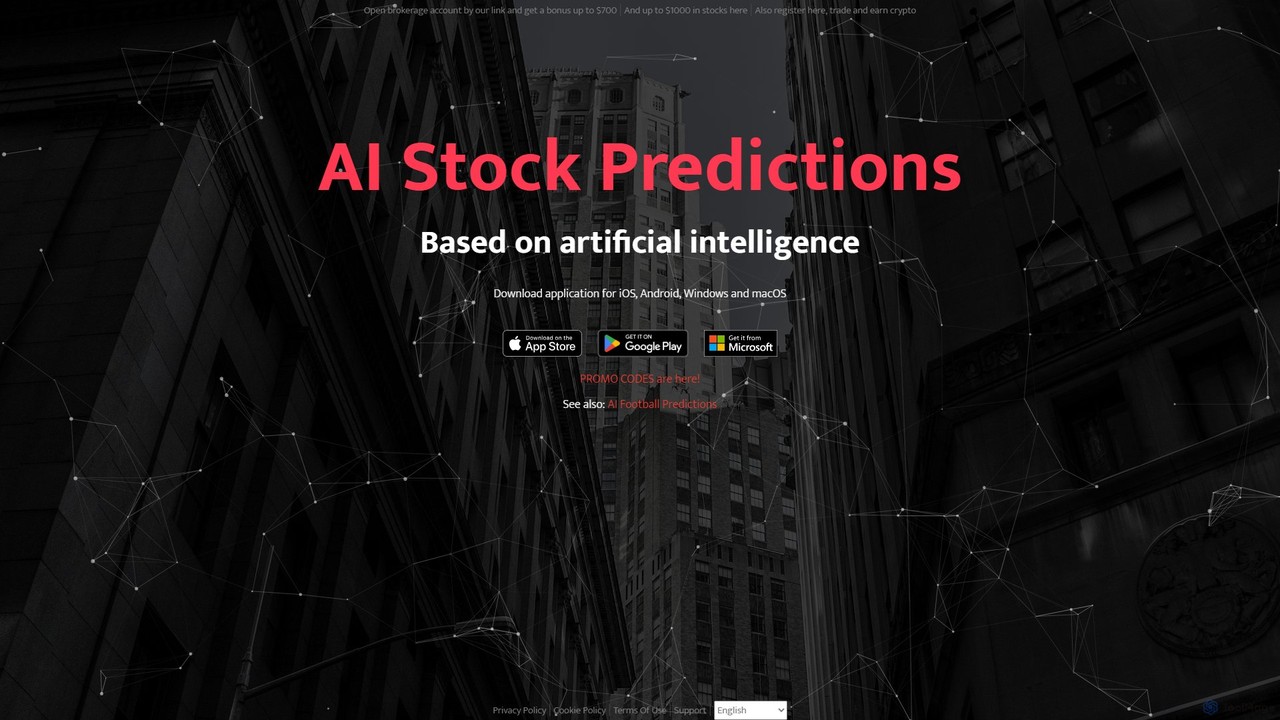
An AI-powered platform providing stock market predictions, trading signals, and securities forecasts. Available on iOS, Android, Windows, and macOS, it helps investors make data-driven decisions by leveraging artificial intelligence to analyze market trends.

Investing
Visits 7.2KFavorites 126Likes 121
Quantera.ai

Quantera.ai

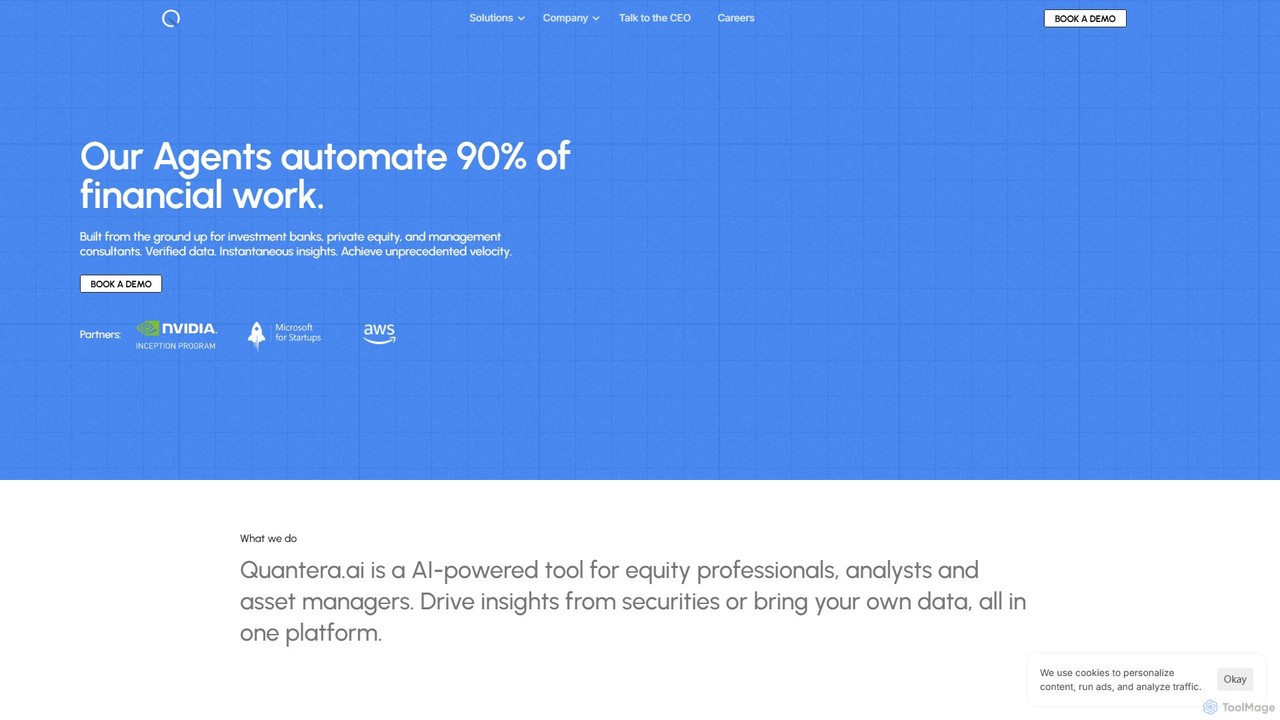
Quantera.ai is an AI-powered platform designed for equity professionals, analysts, and asset managers. It utilizes advanced AI agents to transform vast amounts of unstructured financial data into actionable, verifiable insights, significantly accelerating research, analysis, and decision-making processes.

Market Research
Visits 5.6KFavorites 143Likes 150
feetr
Paid

feetr

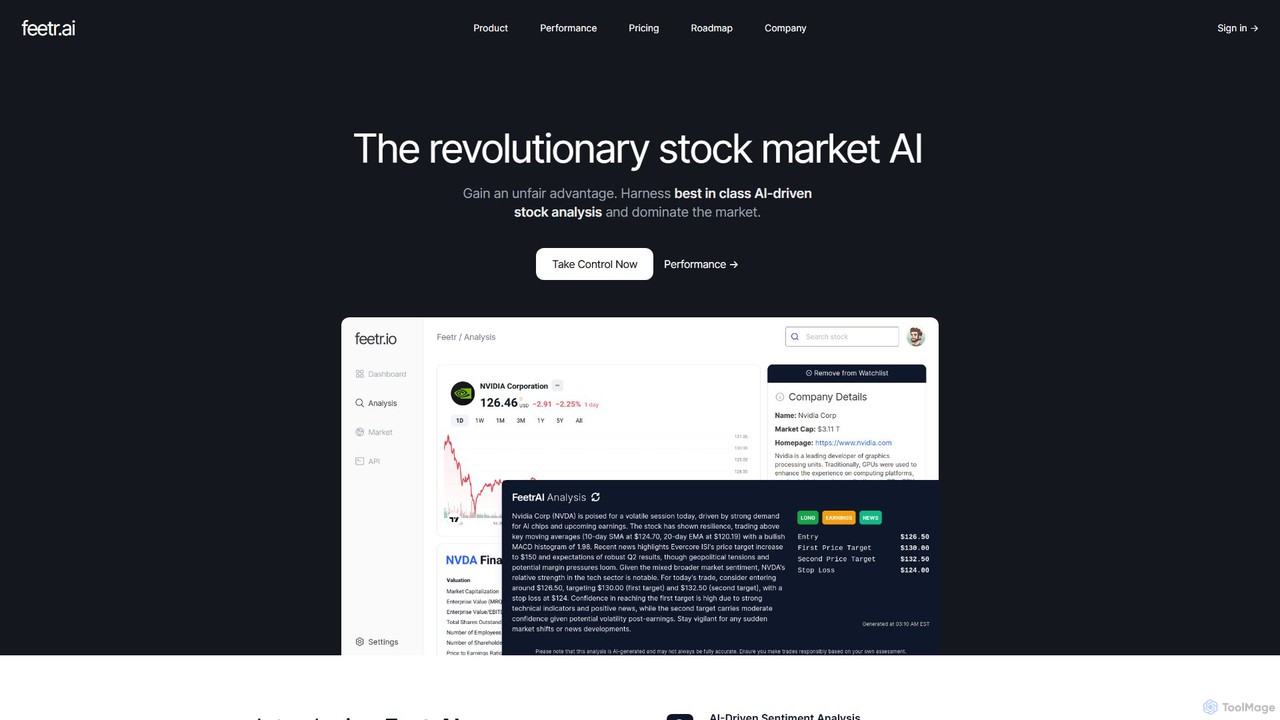
Feetr is an advanced AI-powered platform for stock market analysis. It provides traders with a competitive edge by delivering real-time, data-driven insights, global sentiment analysis, and precise price targets. The tool is designed for retail, whale, and institutional traders.

Stock Market
Visits 5.5KFavorites 146Likes 153
Bracketwise

Bracketwise

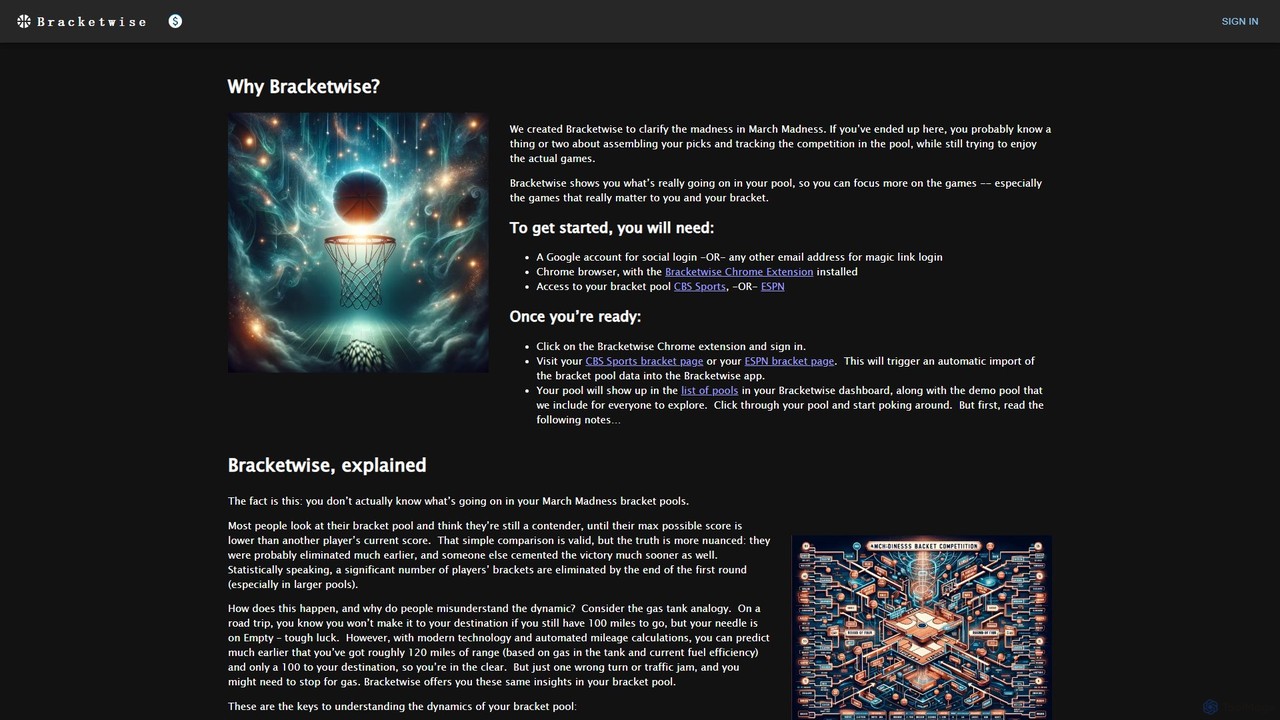
An advanced analytics tool for March Madness bracket pools. Bracketwise imports your pool data from ESPN or CBS Sports via a Chrome extension to provide deep insights beyond simple leaderboards. It reveals your true standing, identifies must-win games, and simulates future outcomes to help you master your pool's dynamics.

Games
Visits 5.7KFavorites 140Likes 116
Amplitude
Freemium

Amplitude

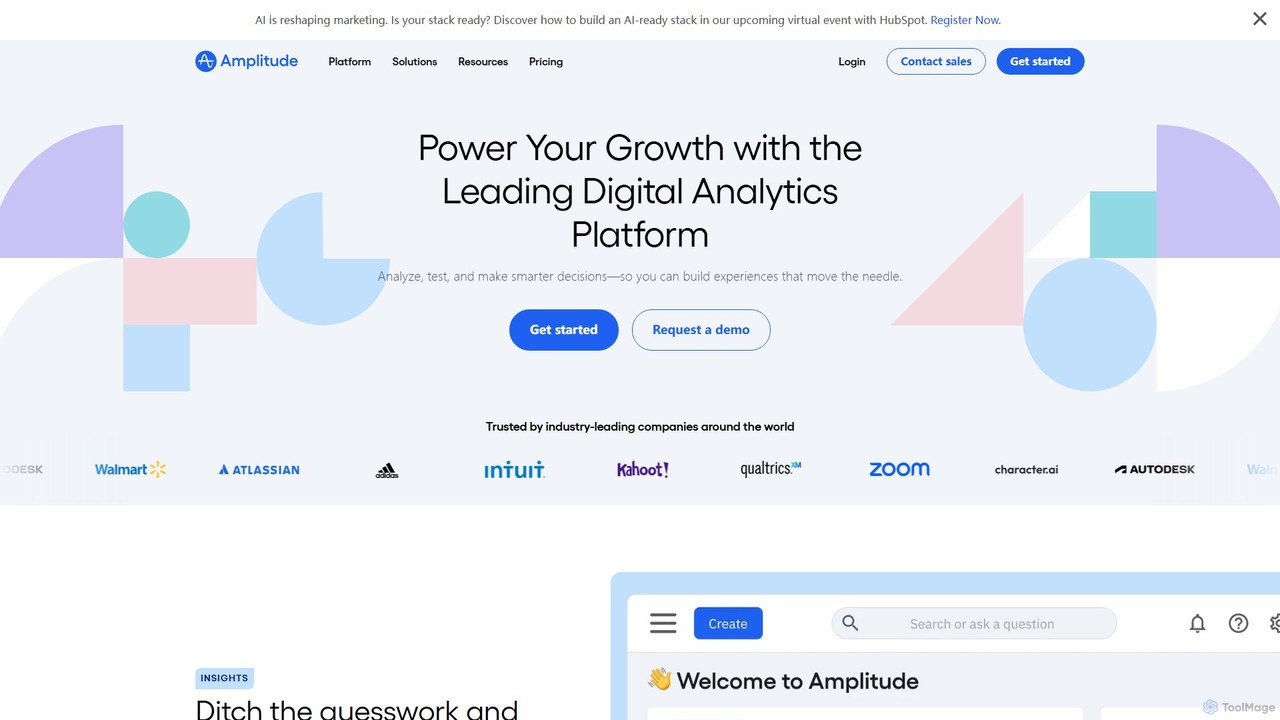
Amplitude is a leading digital analytics platform that uses AI to help businesses understand user behavior, optimize products, and drive growth. It provides a unified solution for product analytics, session replay, A/B testing, and feature management, enabling teams to make data-driven decisions and build better customer experiences.

Analytics
Visits 1.4MFavorites 156Likes 147

About Data Analysis

AI Data Analysis tools are a specialized category of productivity software that use machine learning and natural language processing to automate the interpretation of complex datasets. These tools go beyond traditional spreadsheets by automatically cleaning data, identifying patterns, and generating predictive models. Their primary value lies in transforming raw data into actionable insights, enabling users without deep statistical knowledge to make informed, data-driven decisions quickly. They excel at uncovering hidden correlations and forecasting future trends with high accuracy.

Core Features

  • Natural Language Querying: Ask questions about your data in plain English, eliminating the need for complex code or formulas.
  • Automated Insight Generation: The AI automatically detects significant trends, anomalies, and correlations in your data and presents them as simple summaries.
  • Predictive Modeling & Forecasting: Build and deploy models to forecast future outcomes, such as sales revenue, customer churn, or inventory demand.
  • Automated Data Preparation: Automatically cleans, formats, and enriches raw data, saving significant time and reducing human error.
  • Interactive Visualizations: Generate dynamic charts, graphs, and dashboards that allow for intuitive exploration of data.

Use Cases

These tools are widely used across various departments. Marketing teams use them to analyze campaign performance and customer behavior. Financial analysts leverage them for forecasting and anomaly detection. Operations managers apply them to optimize supply chains and production processes. Essentially, any role that relies on data for decision-making can benefit.

How to Choose

When selecting an AI Data Analysis tool, consider the types of data sources you need to connect to (e.g., databases, SaaS apps, spreadsheets). Evaluate the user interface: is it a no-code platform for business users or does it require some technical expertise? Also, assess the depth of its analytical capabilities—whether you need simple descriptive analytics or more advanced predictive and prescriptive insights. Finally, consider scalability and pricing models.

Featured tool rankings

Data Analysis use cases

1

Analyze Marketing Campaign ROI

A marketing manager for an e-commerce brand needs to understand the effectiveness of various digital advertising campaigns. Instead of manually exporting data from Google Ads, Facebook, and email platforms into a spreadsheet, they connect these sources to an AI Data Analysis tool. The tool automatically unifies the data, calculates the return on investment (ROI) for each channel, and uses natural language to summarize key findings, such as 'The summer campaign on Instagram generated the highest conversion rate among users aged 25-34.' This allows the manager to reallocate budget to high-performing channels in minutes rather than days.

2

Forecast Future Sales Trends

A sales director for a retail company wants to prepare for the upcoming holiday season. They upload three years of historical sales data into an AI analysis tool. The tool automatically identifies seasonality, growth trends, and the impact of past promotions. It then generates a forecast predicting sales volume for specific product categories over the next quarter. The director can ask follow-up questions like, 'What if we offer a 20% discount on electronics?' and the model updates the forecast instantly. This data-driven approach helps in optimizing inventory levels and setting realistic sales targets for the team.

3

Identify Causes of Customer Churn

A product manager at a SaaS company notices a slight increase in customer churn. To understand why, they feed customer usage data, support ticket history, and subscription information into an AI analysis platform. The AI model analyzes the data to find common patterns among customers who churned. It might reveal insights like, 'Customers who do not use Feature X within the first 14 days are 70% more likely to churn,' or 'A high number of support tickets related to billing issues is a strong predictor of churn.' These specific, actionable insights allow the product team to improve onboarding and address critical issues proactively.

4

Optimize Supply Chain Logistics

An operations manager for a manufacturing company uses an AI data tool to analyze their supply chain. By integrating data from shipping carriers, warehouse inventory systems, and production schedules, the tool builds a complete picture of the logistics network. It identifies bottlenecks, predicts potential delays based on weather or traffic data, and suggests more efficient shipping routes. For example, it might highlight that a specific distribution center is consistently understocked on Tuesdays, allowing the manager to adjust delivery schedules. This leads to reduced shipping costs, faster delivery times, and minimized production downtime.

5

Detect Financial Anomalies and Fraud

An accounting firm needs to audit a large volume of financial transactions for a client. Manually checking every entry is impractical. They use an AI Data Analysis tool to process the entire transaction log. The AI is trained to recognize normal spending patterns and immediately flags deviations, such as unusually large payments to a new vendor, duplicate invoices, or transactions occurring at odd hours. The system provides a prioritized list of suspicious activities for human auditors to investigate, significantly increasing the efficiency and accuracy of the audit process and helping to uncover potential fraud that might otherwise be missed.

6

Analyze Customer Feedback at Scale

A product team receives thousands of customer reviews, survey responses, and support chats each month. It's impossible for a person to read and categorize them all. They use an AI Data Analysis tool with text analysis capabilities. The tool processes all the unstructured text, performs sentiment analysis (positive, negative, neutral), and identifies recurring themes or topics. It generates a dashboard showing that 'slow performance' is the most common negative topic this month, while 'new user interface' is receiving positive feedback. This allows the team to quickly prioritize bug fixes and feature improvements based on quantitative feedback data.

Data Analysis FAQ

What are AI Data Analysis tools?

AI Data Analysis tools are applications that use artificial intelligence, particularly machine learning, to automate the process of cleaning, analyzing, and interpreting data. Unlike traditional business intelligence (BI) tools that require users to manually explore data, AI tools can automatically surface key insights, identify trends, and build predictive models. They often feature natural language interfaces, allowing non-technical users to ask complex questions and receive easy-to-understand answers, charts, and summaries. Their goal is to make data science accessible to a broader audience within an organization.

How to choose the right AI Data Analysis tool?

Choosing the right tool depends on your specific needs. Consider the following factors:

  • Data Connectivity: Ensure the tool can easily connect to your data sources, whether they are databases, cloud applications like Salesforce, or simple CSV files.
  • User Skill Level: Select a tool that matches your team's expertise. Some are no-code platforms designed for business analysts, while others offer more advanced features for data scientists who can use SQL or Python.
  • Analysis Type: Determine if you need descriptive analysis (what happened), diagnostic analysis (why it happened), or predictive/prescriptive analysis (what will happen and what to do).
  • Scalability and Performance: Consider the volume of data you will be analyzing. The tool should be able to handle your current and future data needs without significant performance degradation.
What's the difference between AI Data Analysis and traditional BI tools?

The primary difference lies in automation and intelligence. Traditional Business Intelligence (BI) tools, like Tableau or Power BI, are excellent for data visualization and exploration but require the user to ask the right questions and manually build dashboards. AI Data Analysis tools augment this process. They can automatically discover insights, suggest relevant visualizations, and perform predictive analytics without explicit instruction. While BI tools answer 'what happened?', AI tools aim to also answer 'why did it happen?' and 'what will happen next?'. Many modern platforms now blend features of both.

Do I need coding skills to use AI Data Analysis tools?

Not necessarily. A major trend in this category is the development of no-code and low-code platforms. Many leading AI Data Analysis tools are designed specifically for business users, marketers, and analysts who do not have a background in programming. They use drag-and-drop interfaces and natural language queries to make analysis accessible. However, some platforms also offer advanced capabilities for data scientists, providing integrations with languages like Python and R for custom modeling and deeper analysis. So, there are tools available for every skill level.

What kind of data can these tools analyze?

Modern AI Data Analysis tools are versatile and can handle a wide variety of data types. This includes:

  • Structured Data: This is highly organized data typically found in spreadsheets and relational databases, such as sales figures, customer lists, and financial records.
  • Unstructured Data: This includes data without a predefined format, such as text from customer reviews, social media posts, emails, and support tickets. Many tools use Natural Language Processing (NLP) to extract insights from this type of data.
  • Time-Series Data: Data points indexed in time order, like stock prices, website traffic over time, or sensor readings, which are crucial for forecasting.

The best tools can often join and analyze data from multiple sources and formats simultaneously.