ChartAI
vs
Vizzy
A comprehensive comparison of the core features, performance, user experience, and pricing strategies of two excellent AI tools
Providing objective and detailed selection advice based on real data and user feedback
Overview
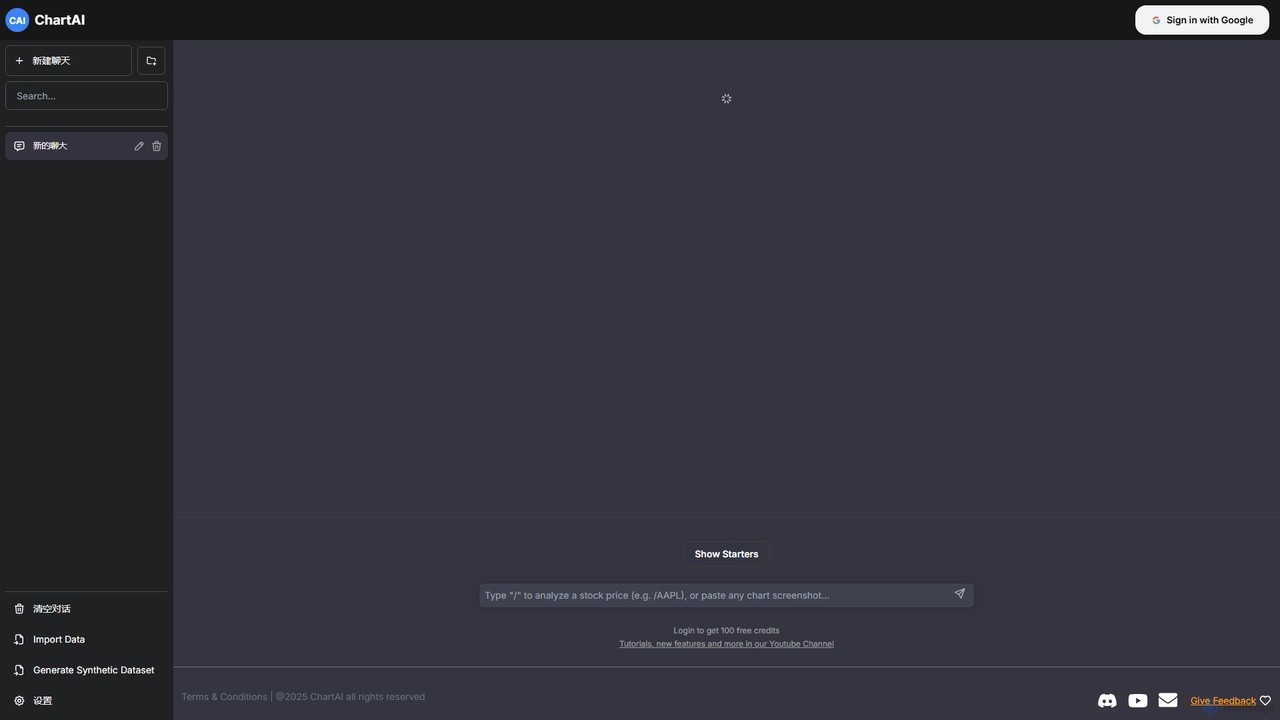
ChartAI Overview
Instantly create charts and graphs from your data using simple text commands with ChartAI. Supports data import, synthetic data generation, and conversational analysis. Turn your data into insights in seconds.
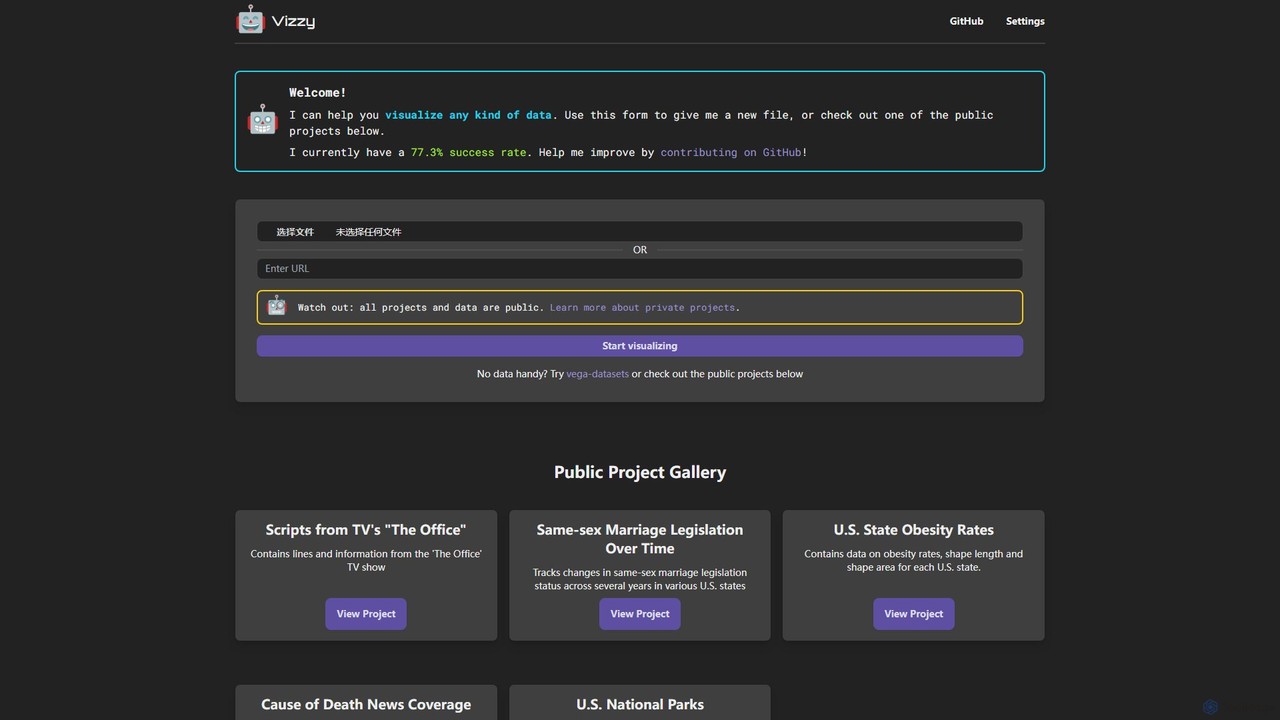
Vizzy Overview
Instantly create stunning charts and graphs with Vizzy. Upload your data and let our LLM-powered AI generate visualizations automatically. A free, open-source, no-code tool for rapid data analysis.
Detailed Feature Comparison
Comprehensive comparison of the core features and characteristics of two AI tools
| Features | ChartAI | Vizzy |
|---|---|---|
| Main Categories | Visualization | Visualization |
| Inclusion Date | 2025-08-09 | 2025-08-07 |
| Pricing Type | Freemium | Freemium |
| Official Website | https://chartai.io/zh | https://vizzy.rbren.io/ |
| Tool Type | Website | Website |
| Performance Data | ||
| User Rating | No Rating Yet | No Rating Yet |
| User Reviews | 0 reviews | 0 reviews |
| Monthly Visits | 27.5K | 2.3K |
| Details | View Details | View Details |
Compare Traffic / Monthly Visits
ChartAI's traffic
ChartAI Current monthly visible visits are 27.5K.
Latest Traffic
Monthly Traffic Trend
Geography
Top 5 Countries/Regions
| Country/Region | Percentage | Traffic |
|---|---|---|
|
🇺🇸
United States
|
40.38% | 11.1K |
|
🇮🇳
India
|
20.84% | 5.7K |
|
🇰🇪
Kenya
|
16.84% | 4.6K |
|
🇻🇳
Vietnam
|
13.68% | 3.8K |
|
🇲🇾
Malaysia
|
8.26% | 2.3K |
Popular Keywords
Vizzy's traffic
Vizzy Current monthly visible visits are 2.3K. This value comes from on-site visit statistics, with no complete third-party traffic analysis available.
Latest Traffic
Monthly Traffic Trend
Usage Comparison
Compare ChartAI and Vizzy 's Advantages
ChartAI's Core Features
Vizzy's Core Features
Use Cases
Understand the specific application scenarios and functional characteristics of the two AI tools
ChartAI Use Cases
Vizzy Use Cases
ChartAI vs Vizzy:In-depth Comparison Analysis and Selection Recommendations
Comprehensive comparison and evaluation based on real data and user feedback
Market Performance and User Preference Analysis
- Core positioning: ChartAI leans more toward Visualization, while Vizzy leans more toward Visualization.
- Traffic Signal: ChartAI currently has higher monthly traffic, serving as a reference for market attention.
- Neither tool has reviewed ratings yet; it is recommended to prioritize comparing functional positioning, price, and actual trial experience.
ChartAI has about 27.5K monthly visits, higher than Vizzy at 2.3K. Use this as a signal of market attention, not as product quality by itself.
In-depth Analysis of User Engagement
ChartAI has relatively complete traffic analysis records, while Vizzy currently uses on-platform monthly visits as the primary reference.
User Reviews vs. Community Feedback
ChartAI has no reviewed ratings yet. Vizzy has no reviewed ratings yet.
Product Positioning and Application Scenario Analysis
ChartAI is in Visualization with a Freemium pricing model; Vizzy is in Visualization with a Freemium pricing model. Prioritize fit for your specific tasks rather than traffic or default ratings alone.
Frequently Asked Questions
FAQs about these two tools to help you better understand their features and differences
What are the biggest differences between the two?
ChartAI is primarily positioned in Visualization, while Vizzy is primarily positioned in Visualization. Which one suits you depends on which type of use case and workflow you need more.
Which tool is better to try first?
ChartAI currently has higher market attention, making it suitable for initial understanding; the final decision should still be based on specific functional needs after trial.
How should ratings and traffic data be interpreted?
Ratings only count reviewed user comments; no default 5-star rating is given when there are no comments. Traffic is used to gauge market attention but cannot solely represent product quality.
Related Tool Recommendations
Discover more excellent AI tools of the same kind
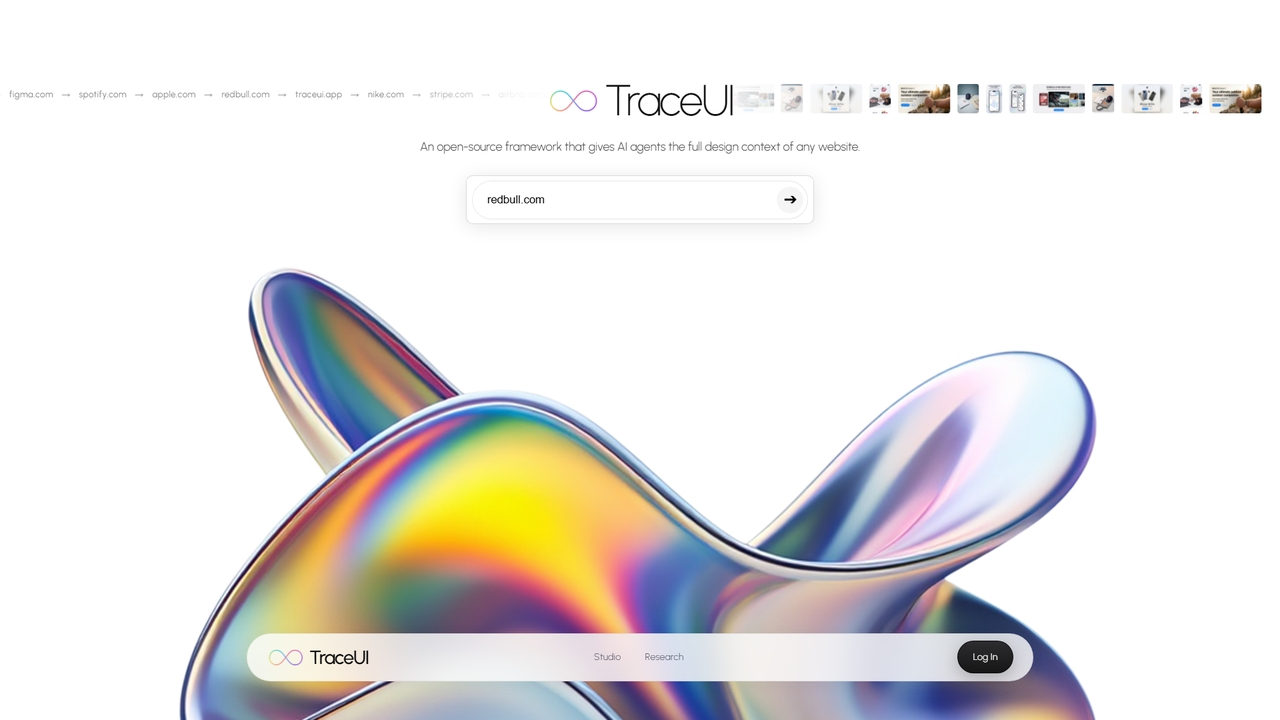
TraceUI
An open-source framework that gives AI agents the full design context of any website, enabling brand-consistent ad generation …
An open-source framework that gives AI agents the full design context of any website, enabling brand-consistent ad generation and mockup creation.
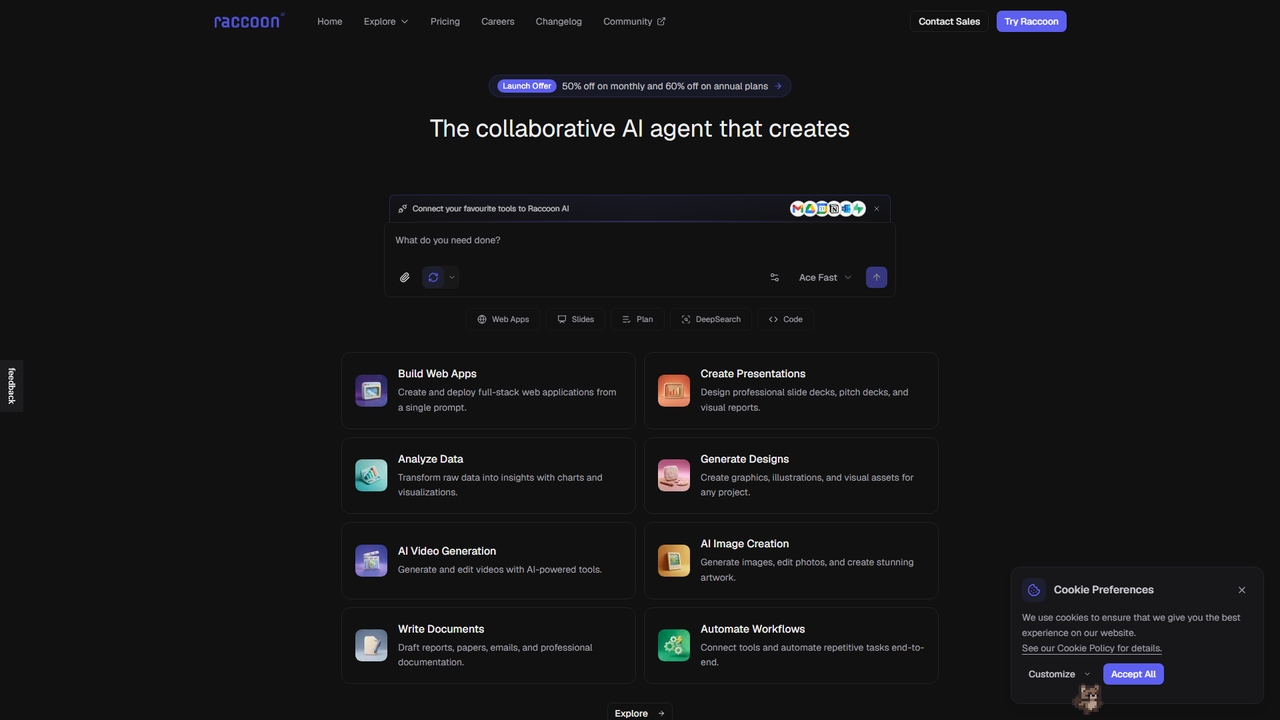
Raccoon AI
Raccoon AI is a collaborative AI workspace that transforms conversations into web applications, presentations, reports, and designs. It …
Raccoon AI is a collaborative AI workspace that transforms conversations into web applications, presentations, reports, and designs. It integrates with your favorite tools to automate and execute complex creative and technical tasks.
Powabase
An energy market intelligence platform that transforms AI assistants into experts by providing real-time, integrated German energy data. …
An energy market intelligence platform that transforms AI assistants into experts by providing real-time, integrated German energy data. Currently in closed beta.
From Process
A platform for operators to quickly create forms, pages, and bio links with embedded options and agent support.
A platform for operators to quickly create forms, pages, and bio links with embedded options and agent support.
Brila
Brila uses AI and the Jobs To Be Done framework to analyze your Google Maps reviews and automatically …
Brila uses AI and the Jobs To Be Done framework to analyze your Google Maps reviews and automatically generate a website with compelling, customer-centric messaging for your local business.
Tweet
Tweet converts X (Twitter) posts and threads into clean, LLM-ready Markdown format. Simply swap 'x.com' with 'tweet.md' in …
Tweet converts X (Twitter) posts and threads into clean, LLM-ready Markdown format. Simply swap 'x.com' with 'tweet.md' in any post URL to get structured text optimized for AI agents, research, and note-taking tools.
Databerry
A business intelligence dashboard for founders that unifies data from tools like Stripe, PostHog, and Google Analytics. Track …
A business intelligence dashboard for founders that unifies data from tools like Stripe, PostHog, and Google Analytics. Track all key metrics like MRR, user sign-ups, and errors on a single page with no code required.
Regent
Regent is a version control system specifically designed for AI coding agents. It tracks every action, prompt, and …
Regent is a version control system specifically designed for AI coding agents. It tracks every action, prompt, and change made by agents like Claude Code and Codex, allowing you to audit, blame, undo, and replay agent sessions locally, providing an essential layer of oversight for AI-driven development.
Emdash
An open-source desktop application for developers to run and orchestrate multiple coding agents (like Codex, Cursor, Claude Code) …
An open-source desktop application for developers to run and orchestrate multiple coding agents (like Codex, Cursor, Claude Code) in parallel, each within its own isolated Git worktree.
ProductLasso
ProductLasso is an AI-powered PIM (Product Information Management) platform for ecommerce. It automates data enrichment, supplier onboarding, and …
ProductLasso is an AI-powered PIM (Product Information Management) platform for ecommerce. It automates data enrichment, supplier onboarding, and competitive monitoring using thousands of specialized AI agents, helping teams save hundreds of hours weekly.
Dreambase
An AI-native analytics platform that connects directly to your Supabase database, providing instant dashboards, reports, and actionable insights …
An AI-native analytics platform that connects directly to your Supabase database, providing instant dashboards, reports, and actionable insights with minimal setup.
Trismik
Compare 50+ LLMs on your own data in minutes. Make evidence-based model decisions on quality, cost, and speed …
Compare 50+ LLMs on your own data in minutes. Make evidence-based model decisions on quality, cost, and speed without guesswork.
Autonoma
Autonoma is an AI-powered supplier discovery and procurement platform that automates the entire sourcing workflow. Describe your needs …
Autonoma is an AI-powered supplier discovery and procurement platform that automates the entire sourcing workflow. Describe your needs in plain language, and its AI agents find verified global suppliers, draft personalized RFIs, manage outreach campaigns, and analyze proposals—reducing manual research from weeks to minutes.
Anvil IDE
Anvil IDE is an open-source integrated development environment specifically designed for orchestrating and managing parallel AI agent workflows. …
Anvil IDE is an open-source integrated development environment specifically designed for orchestrating and managing parallel AI agent workflows. It centralizes control over multiple Claude Code agents working in isolated workspaces, providing real-time progress visibility, native planning tools, and a full-featured editor to accelerate complex AI-assisted development tasks.
People Loop
People Loop is a comprehensive AI support platform featuring chatbots smart enough to escalate complex issues to humans. …
People Loop is a comprehensive AI support platform featuring chatbots smart enough to escalate complex issues to humans. It automates customer support, internal knowledge retrieval, lead generation, and data analysis. With built-in human handoff, seamless integrations, and a focus on security, it's designed for businesses to deploy conversational AI agents without technical expertise.