Line Graph Maker
vs
Pie Chart Maker
A comprehensive comparison of the core features, performance, user experience, and pricing strategies of two excellent AI tools
Providing objective and detailed selection advice based on real data and user feedback
Overview
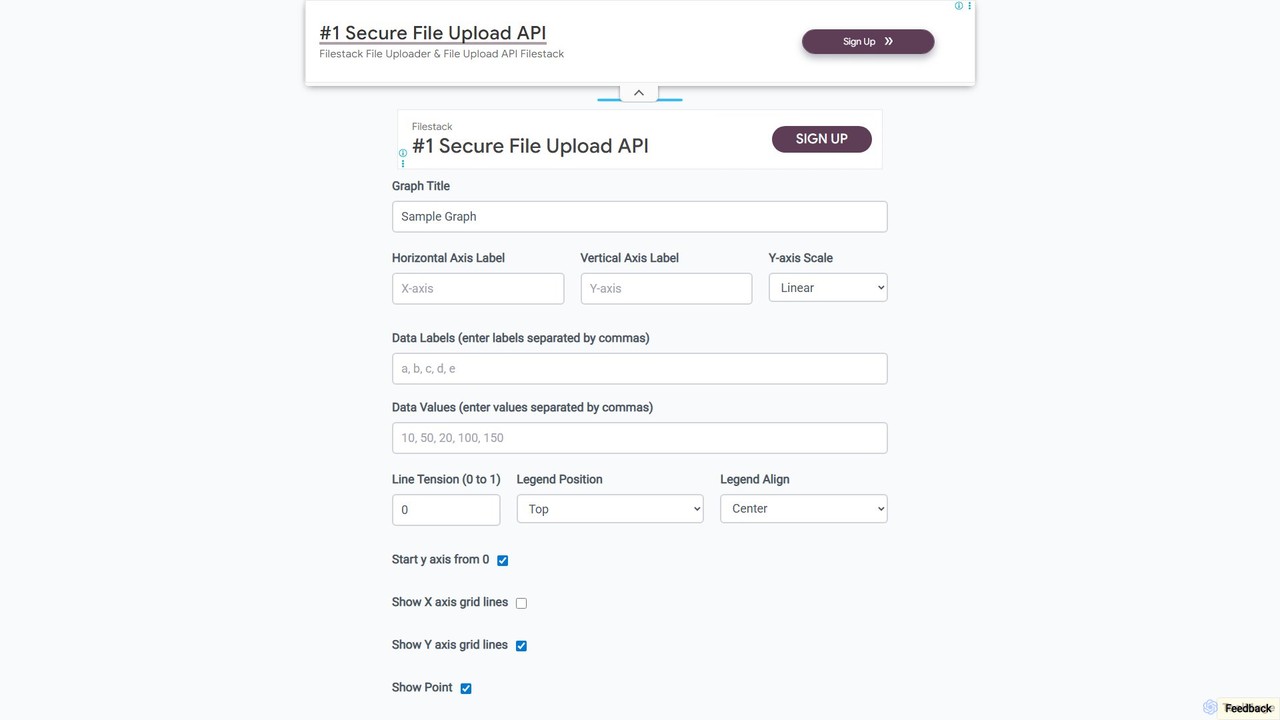
Line Graph Maker Overview
Easily create custom line and bar graphs for free with Line Graph Maker. Input your data, customize labels, colors, and styles, and download your chart as PNG, JPG, or SVG. Perfect for students, business reports, and data analysis.
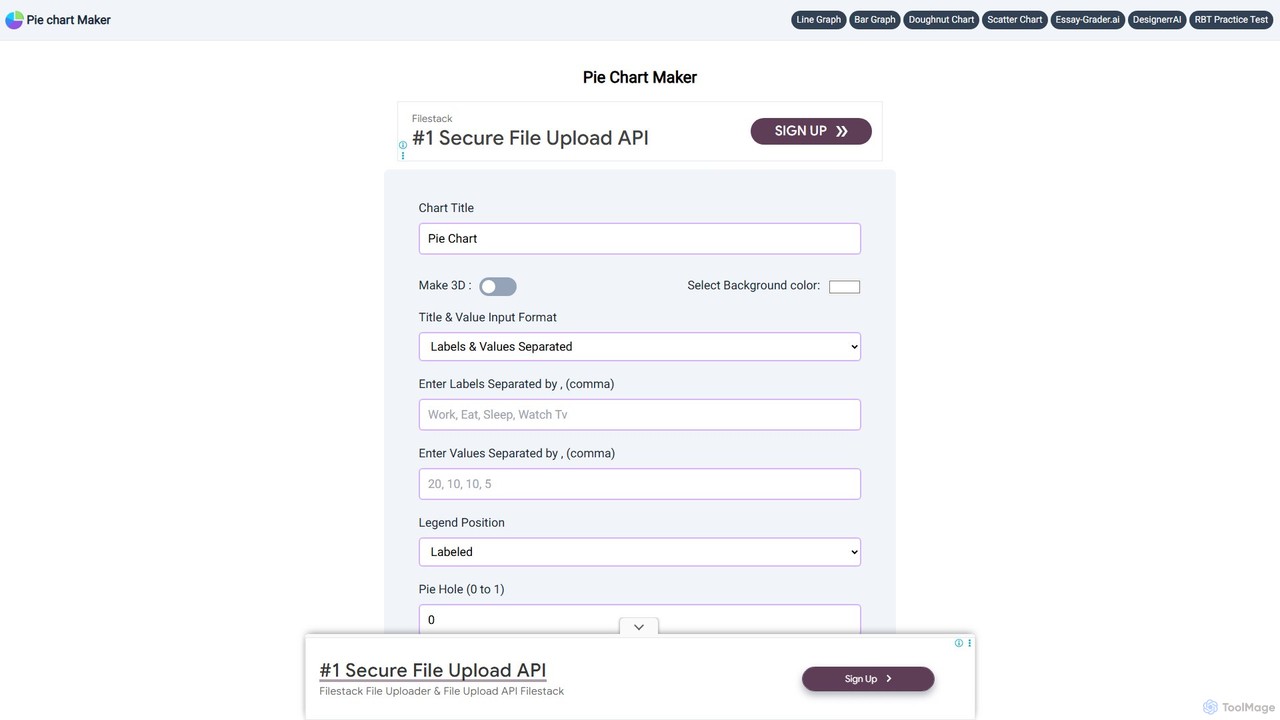
Pie Chart Maker Overview
Easily create stunning pie charts, doughnut charts, and line graphs online for free with Pie Chart Maker. Customize colors, styles, and download in PNG, SVG, or JPEG. No sign-up required.
Detailed Feature Comparison
Comprehensive comparison of the core features and characteristics of two AI tools
| Features | Line Graph Maker | Pie Chart Maker |
|---|---|---|
| Main Categories | Data Visualization | Data Visualization |
| Inclusion Date | 2025-08-16 | 2025-08-14 |
| Pricing Type | Free | Free |
| Official Website | https://linegraphmaker.co/ | https://piechartmaker.co/ |
| Tool Type | Website | Website |
| Performance Data | ||
| User Rating | No Rating Yet | No Rating Yet |
| User Reviews | 0 reviews | 0 reviews |
| Monthly Visits | 48.1K | 54.9K |
| Details | View Details | View Details |
Compare Traffic / Monthly Visits
Line Graph Maker's traffic
Line Graph Maker Current monthly visible visits are 48.1K.
Latest Traffic
Monthly Traffic Trend
Geography
Top 5 Countries/Regions
| Country/Region | Percentage | Traffic |
|---|---|---|
|
🇺🇸
United States
|
54.89% | 26.4K |
|
🇵🇭
Philippines
|
15.02% | 7.2K |
|
🇨🇦
Canada
|
13.79% | 6.6K |
|
🇮🇳
India
|
8.48% | 4.1K |
|
🇦🇺
Australia
|
7.82% | 3.8K |
Traffic source
| Source Type | Percentage | Traffic |
|---|---|---|
|
Direct Access
|
95.29% | 45.8K |
|
Referral
|
4.71% | 2.3K |
Popular Keywords
Pie Chart Maker's traffic
Pie Chart Maker Current monthly visible visits are 54.9K.
Latest Traffic
Monthly Traffic Trend
Geography
Top 5 Countries/Regions
| Country/Region | Percentage | Traffic |
|---|---|---|
|
🇺🇸
United States
|
67.56% | 37.1K |
|
🇬🇧
United Kingdom
|
10.87% | 6.0K |
|
🇵🇭
Philippines
|
8.38% | 4.6K |
|
🇨🇦
Canada
|
6.82% | 3.7K |
|
🇮🇳
India
|
6.37% | 3.5K |
Traffic source
| Source Type | Percentage | Traffic |
|---|---|---|
|
Direct Access
|
70.14% | 38.5K |
|
Referral
|
26.44% | 14.5K |
|
Email
|
3.42% | 1.9K |
Popular Keywords
Usage Comparison
Compare Line Graph Maker and Pie Chart Maker 's Advantages
Line Graph Maker's Core Features
Pie Chart Maker's Core Features
Use Cases
Understand the specific application scenarios and functional characteristics of the two AI tools
Line Graph Maker Use Cases
Pie Chart Maker Use Cases
Line Graph Maker vs Pie Chart Maker:In-depth Comparison Analysis and Selection Recommendations
Comprehensive comparison and evaluation based on real data and user feedback
Market Performance and User Preference Analysis
- Core positioning: Line Graph Maker leans more toward Data Visualization, while Pie Chart Maker leans more toward Data Visualization.
- Traffic Signal: Pie Chart Maker currently has higher monthly traffic, serving as a reference for market attention.
- Neither tool has reviewed ratings yet; it is recommended to prioritize comparing functional positioning, price, and actual trial experience.
Pie Chart Maker has about 54.9K monthly visits, higher than Line Graph Maker at 48.1K. Use this as a signal of market attention, not as product quality by itself.
In-depth Analysis of User Engagement
Both tools have third-party traffic analysis records, allowing comparison of visits, dwell time, pages per visit, and bounce rate; these metrics should be considered alongside the tool's purpose.
User Reviews vs. Community Feedback
Line Graph Maker has no reviewed ratings yet. Pie Chart Maker has no reviewed ratings yet.
Product Positioning and Application Scenario Analysis
Line Graph Maker is in Data Visualization with a Free pricing model; Pie Chart Maker is in Data Visualization with a Free pricing model. Prioritize fit for your specific tasks rather than traffic or default ratings alone.
Frequently Asked Questions
FAQs about these two tools to help you better understand their features and differences
What are the biggest differences between the two?
Line Graph Maker is primarily positioned in Data Visualization, while Pie Chart Maker is primarily positioned in Data Visualization. Which one suits you depends on which type of use case and workflow you need more.
Which tool is better to try first?
Pie Chart Maker currently has higher market attention, making it suitable for initial understanding; the final decision should still be based on specific functional needs after trial.
How should ratings and traffic data be interpreted?
Ratings only count reviewed user comments; no default 5-star rating is given when there are no comments. Traffic is used to gauge market attention but cannot solely represent product quality.
Related Tool Recommendations
Discover more excellent AI tools of the same kind
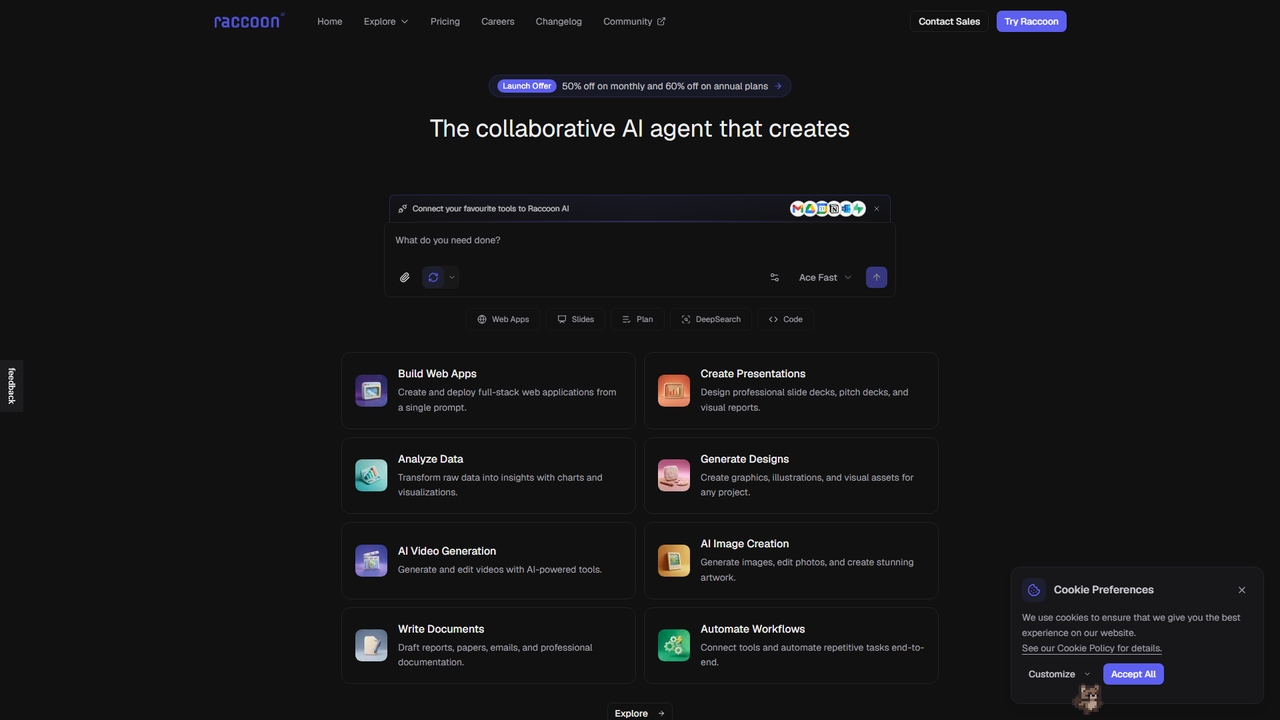
Raccoon AI
Raccoon AI is a collaborative AI workspace that transforms conversations into web applications, presentations, reports, and designs. It …
Raccoon AI is a collaborative AI workspace that transforms conversations into web applications, presentations, reports, and designs. It integrates with your favorite tools to automate and execute complex creative and technical tasks.
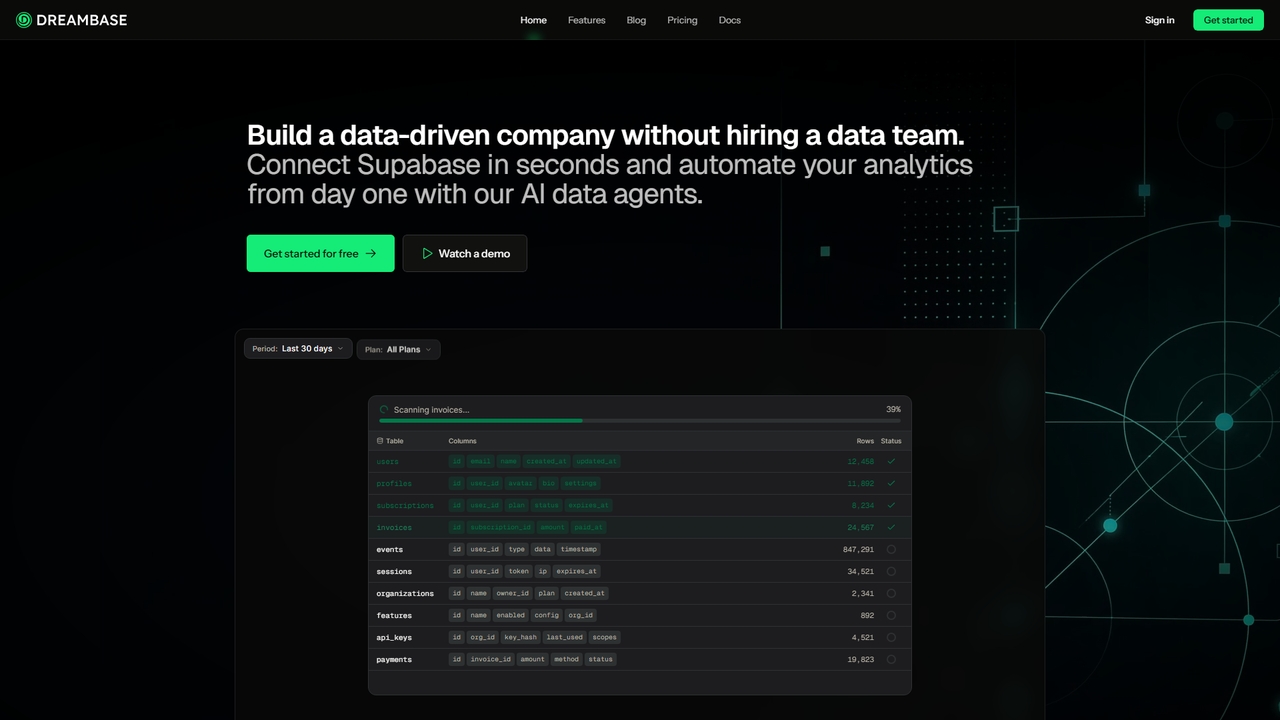
Dreambase
An AI-native analytics platform that connects directly to your Supabase database, providing instant dashboards, reports, and actionable insights …
An AI-native analytics platform that connects directly to your Supabase database, providing instant dashboards, reports, and actionable insights with minimal setup.

GitFit
GitFit is an AI-powered fitness and habit-tracking application that combines calorie counting, activity logging, and progress visualization. It …
GitFit is an AI-powered fitness and habit-tracking application that combines calorie counting, activity logging, and progress visualization. It allows you to track any custom metric using AI scanning, featuring a clean interface inspired by GitHub commit charts. Your data is fully encrypted and exportable, ensuring privacy and flexibility.

Faces
Faces is a modern presentation tool designed to break free from static slides. It enables users, particularly entrepreneurs, …
Faces is a modern presentation tool designed to break free from static slides. It enables users, particularly entrepreneurs, to create interactive and explorable presentations that leverage the full power of the web, making ideas more engaging and effective for pitches, portfolios, guides, and proposals.

Mycomplaints
Mycomplaints is an AI-powered complaint management platform designed to enhance efficiency, accuracy, and compliance across the complaint lifecycle. …
Mycomplaints is an AI-powered complaint management platform designed to enhance efficiency, accuracy, and compliance across the complaint lifecycle. It leverages generative AI for analysis, investigation, root cause identification, and response drafting, all with human oversight. Integrated with leading customer service solutions and tailored for regulated industries, it ensures transparent and trusted outcomes.
myChintak
myChintak is an AI-powered platform that transforms natural language prompts into instant data insights, dynamic reports, and interactive …
myChintak is an AI-powered platform that transforms natural language prompts into instant data insights, dynamic reports, and interactive dashboards. It connects to various data sources, enabling businesses to quickly analyze performance, understand customer behavior, and make data-driven decisions without complex coding.
Guardrail Layer
Guardrail Layer enables safe, natural language interaction with your databases, providing robust role-based access control, automatic PII redaction, …
Guardrail Layer enables safe, natural language interaction with your databases, providing robust role-based access control, automatic PII redaction, and comprehensive audit trails. It empowers teams to query data in plain English without SQL, preventing unauthorized access and ensuring data security in production environments while leveraging AI capabilities.
EduDetector
EduDetector is a leading AI detection and writing suite trusted by educators and content creators worldwide. It offers …
EduDetector is a leading AI detection and writing suite trusted by educators and content creators worldwide. It offers 99%+ accurate AI content detection for models like ChatGPT, GPT-4, and Claude, along with a comprehensive set of tools including citation generation, grammar checking, summarization, paraphrasing, content rewriting, and an AI humanizer. Designed to uphold academic integrity and enhance content authenticity, EduDetector supports a seamless workflow for validating and refining written work.
TrendyPeak
TrendyPeak is an AI-powered market intelligence platform designed to help businesses discover and track fast-growing industry keywords and …
TrendyPeak is an AI-powered market intelligence platform designed to help businesses discover and track fast-growing industry keywords and companies. It provides real-time trend data, comprehensive analytics, and actionable insights to identify strategic growth opportunities and gain a competitive advantage across over 30 industries.

SnapScale
SnapScale is an innovative mobile application that transforms any traditional bathroom scale into a smart weight tracking device. …
SnapScale is an innovative mobile application that transforms any traditional bathroom scale into a smart weight tracking device. By simply snapping a photo of your scale's display, the app captures and logs your weight, integrating it seamlessly with Apple Health. It provides AI-powered insights, tracks long-term trends, weekly averages, and helps users understand how factors like sleep and menstrual cycle influence their weight journey.
FindZam
FindZam is an AI-powered recommendation engine that helps users discover personalized movies, series, games, music, books, and more. …
FindZam is an AI-powered recommendation engine that helps users discover personalized movies, series, games, music, books, and more. By analyzing individual tastes, it provides ultra-fast, accurate, and tailored suggestions, ensuring users always find content they'll love. It's completely free and respects user privacy.
Pane
Pane is an AI-native spreadsheet designed for modern teams, integrating artificial intelligence to streamline data creation, analysis, and …
Pane is an AI-native spreadsheet designed for modern teams, integrating artificial intelligence to streamline data creation, analysis, and collaboration. It allows users to interact with their data using natural language commands, automate tasks, and generate professional dashboards effortlessly, enhancing productivity and insights.
Frami
Frami is an AI-powered design tool that transforms raw app screenshots into professional, high-converting App Store previews in …
Frami is an AI-powered design tool that transforms raw app screenshots into professional, high-converting App Store previews in seconds. It simplifies the creation of visually stunning app store assets without requiring design skills or complex tools, offering a fast, free, and intuitive 3-step process for developers and marketers.
ChartGen
ChartGen is an AI-powered chart generator that transforms raw data into stunning, professional visualizations in seconds. Users simply …
ChartGen is an AI-powered chart generator that transforms raw data into stunning, professional visualizations in seconds. Users simply upload CSV or Excel files, describe their desired chart in plain English, and the AI instantly creates various chart types like bar, line, and pie charts. It's designed for quick, effortless data visualization without requiring design or coding skills.
Sulta AI
Sulta AI is a no-code platform empowering users to build and deploy custom AI agents for any task, …
Sulta AI is a no-code platform empowering users to build and deploy custom AI agents for any task, from student research to business operations. It offers a rich library of pre-built agents, community sharing, and data training capabilities to revolutionize individual and team workflows without writing a single line of code.