ToolMage
Sign in

Best 37 Reporting AI tools for Productivity

Popular Reporting AI tools in Productivity include Microsoft Power BI, Sisense, Visible, Local Falcon, Flowpoint, InspectMind, Breadcrumb.ai, Kurby, Adsroid, and Modeliks, helping you work more efficiently.

GenRPT
Freemium

GenRPT

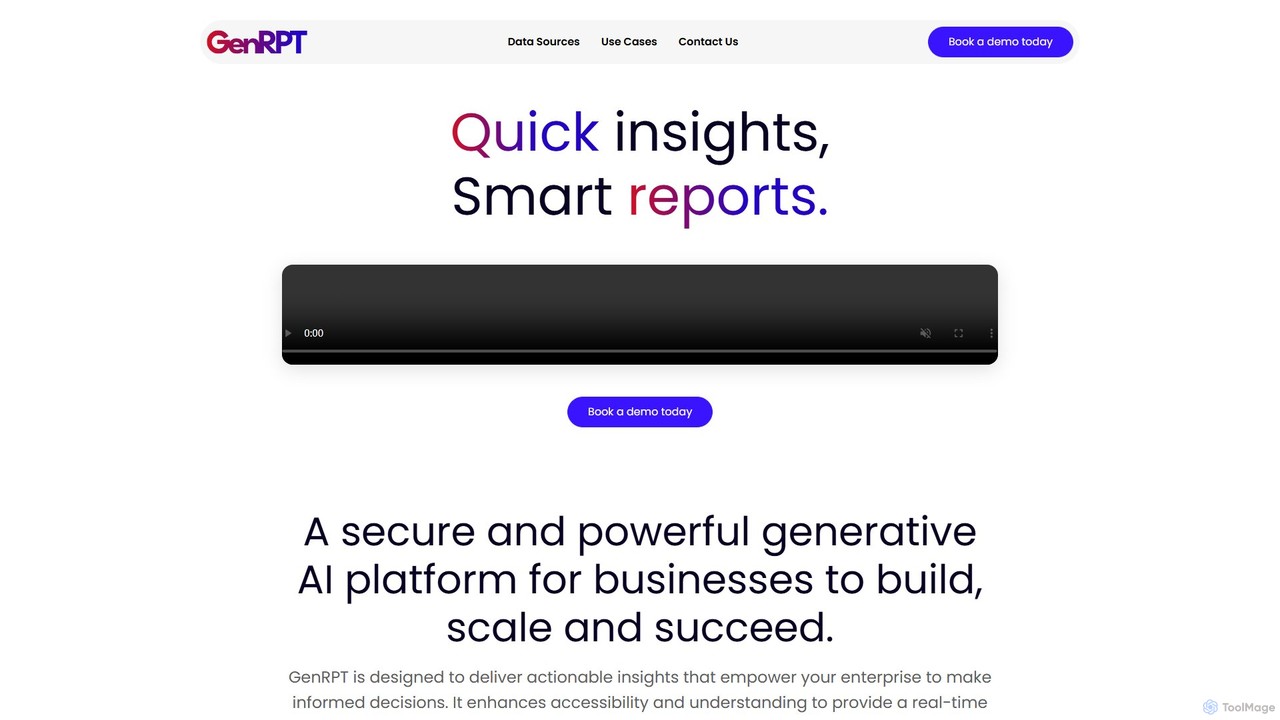
GenRPT is an AI-powered platform that transforms data from SQL, PDF, and Excel into actionable insights and reports. Connect your data sources, ask questions in natural language, and receive instant analysis, summaries, and visualizations to accelerate data-driven decision-making.

Business Intelligence
Visits 8.5KFavorites 135Likes 144
Marketing Auditor
Paid

Marketing Auditor

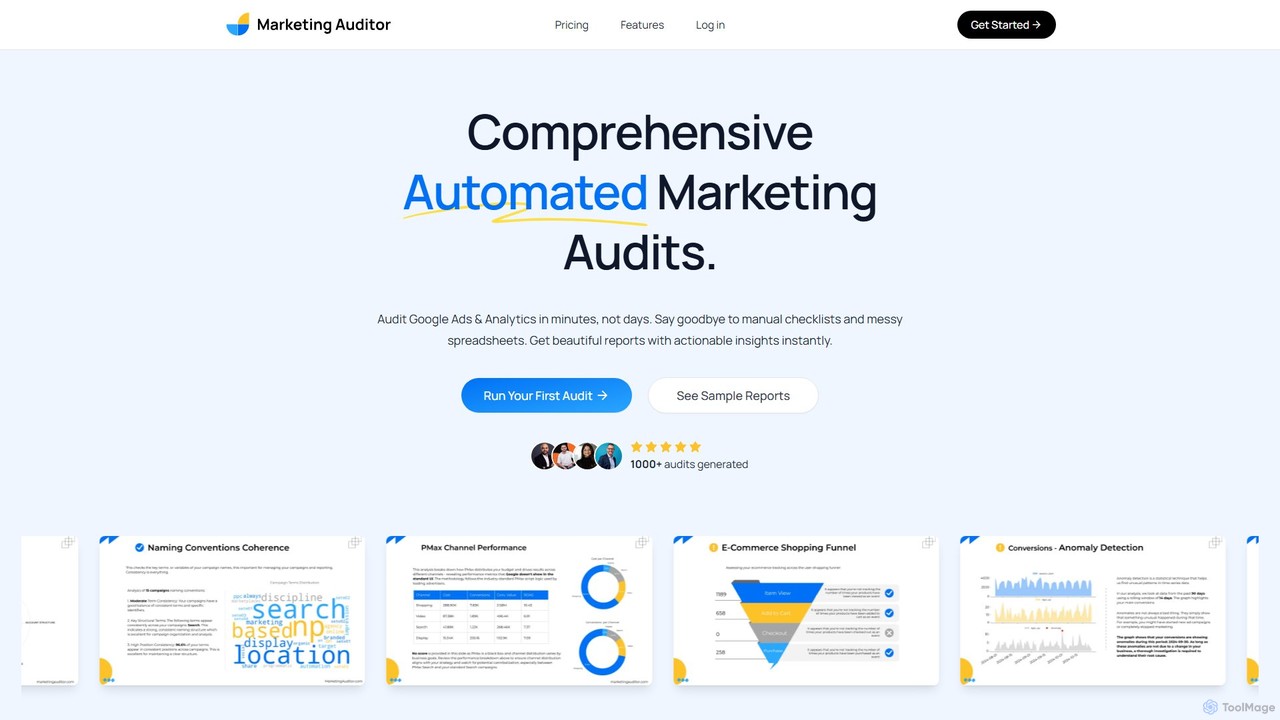
Marketing Auditor is an automated tool that generates comprehensive marketing audits for Google Ads and Google Analytics in minutes. It replaces manual checklists and spreadsheets, providing beautiful, white-labeled reports with actionable insights. Ideal for marketing agencies and brands looking to optimize performance, win new clients, and save countless hours on reporting.

Advertising
Visits 8.4KFavorites 151Likes 147
We Report Work
Freemium

We Report Work

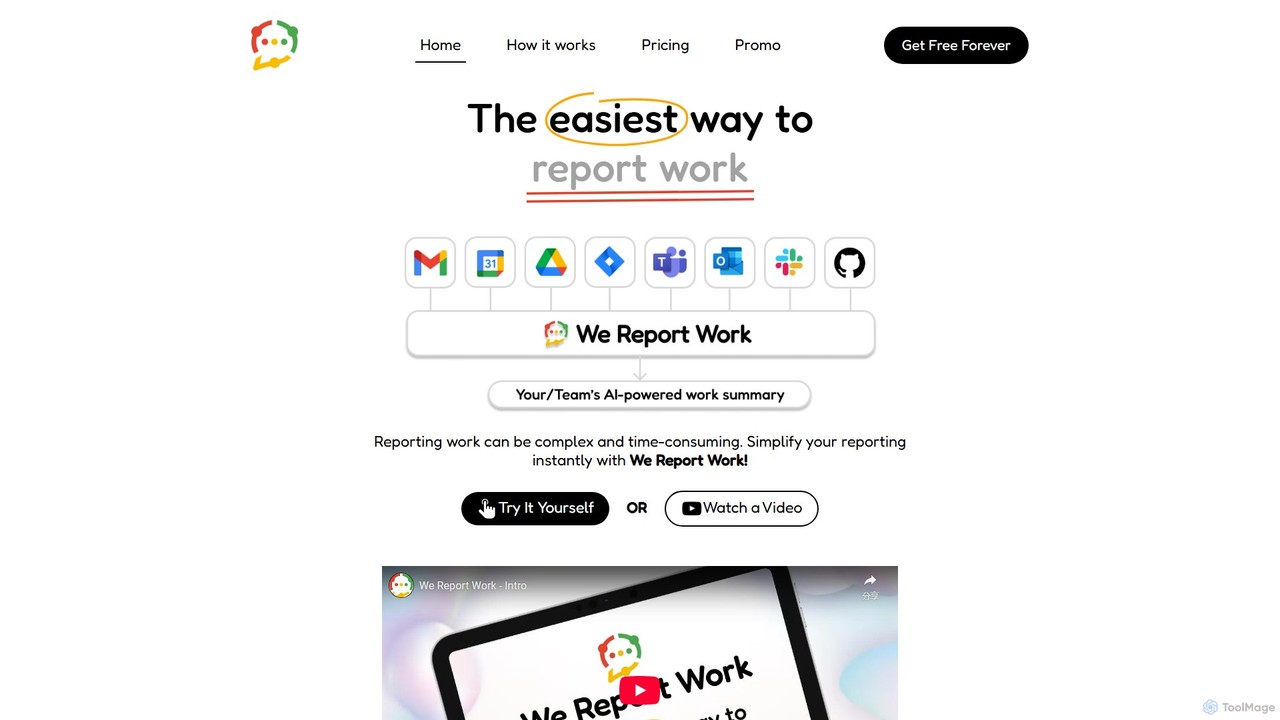
We Report Work is an AI-powered software that automates work reporting. It connects to your work tools like Google Workspace to generate instant, data-driven summaries, enhancing team accountability, improving remote work management, and helping leaders identify top performers effortlessly.

Performance Management
Visits 5.6KFavorites 132Likes 147
Capitara

Capitara

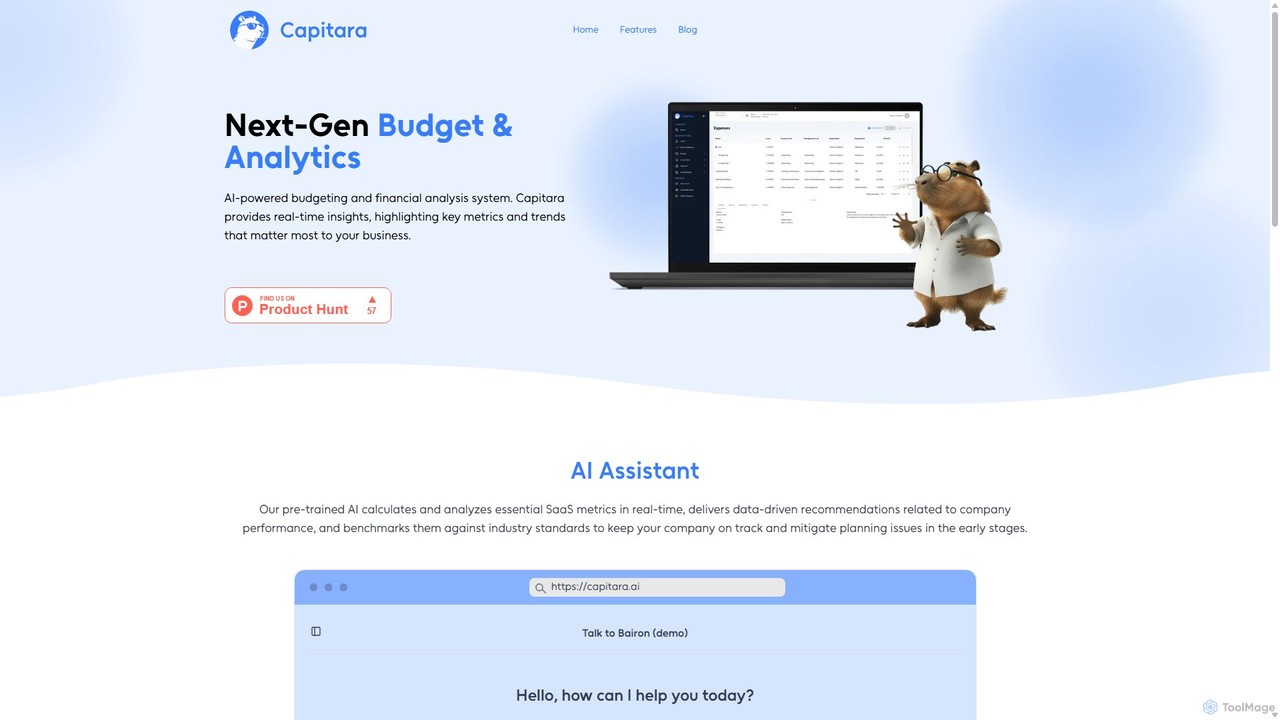
Capitara is a next-generation, AI-powered platform for financial planning and analysis (FP&A). It automates budgeting, provides real-time SaaS metric tracking, and features an AI assistant, Bairon, to deliver data-driven insights and industry benchmarks. Designed for modern businesses, it simplifies complex financial management, enhances collaboration, and enables faster, more informed decision-making.

Analytics
Visits 5.5KFavorites 153Likes 153
Microsoft Power BI
Freemium

Microsoft Power BI

Microsoft Power BI is a leading business analytics and data visualization platform that empowers users to connect to, model, and visualize their data. It leverages AI-powered features like natural language Q&A and automated insights to uncover hidden patterns, create interactive reports and dashboards, and facilitate data-driven decision-making across an organization.

Business Intelligence
Visits 53.6MFavorites 108Likes 96
Entrov
Freemium

Entrov

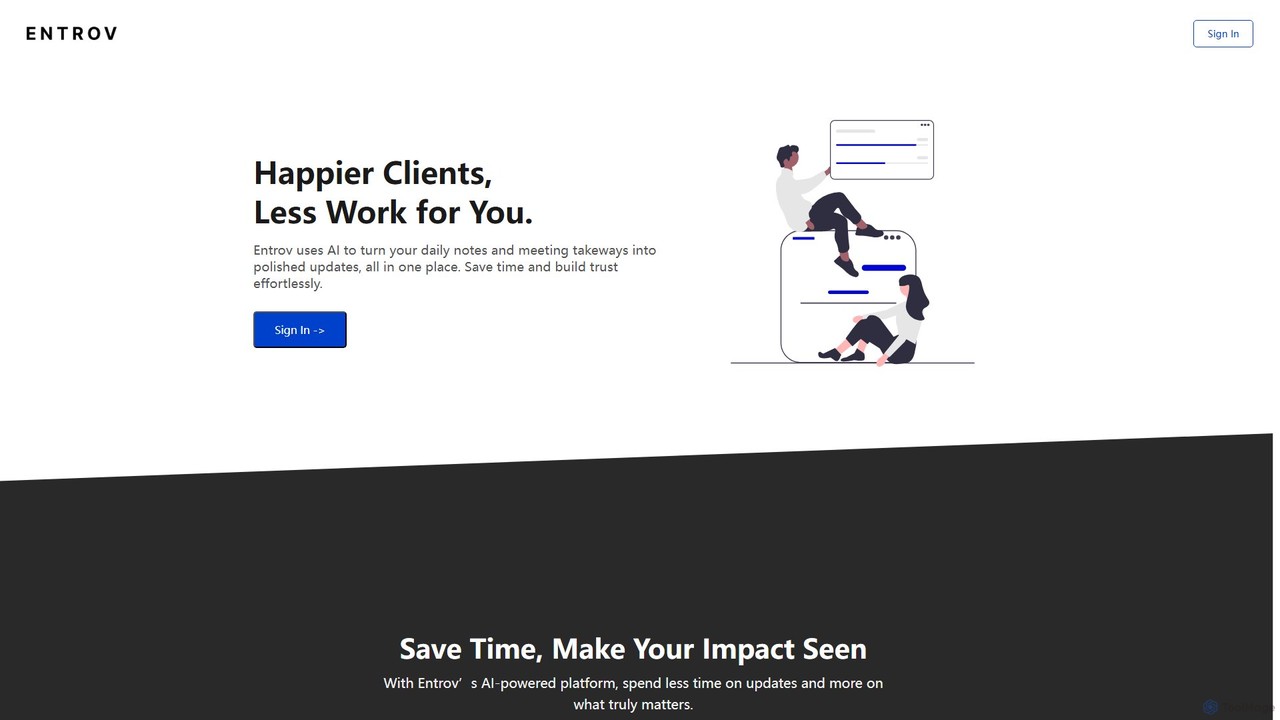
Entrov is an AI-powered platform designed to streamline progress reporting. It allows users to quickly capture updates via text, voice, files, or screenshots, and then uses AI to automatically generate clear, professional summaries. This saves valuable time, enhances client communication, and ensures your impact is clearly seen, allowing you to focus more on your core work and less on writing updates.

Communication
Visits 5.6KFavorites 122Likes 124
Visible
Freemium

Visible

Visible is an investor relationship management platform for startups and VCs. It helps founders streamline fundraising, share updates, and track metrics. For investors, it centralizes portfolio data, provides analytics, and simplifies LP reporting, featuring an AI-powered inbox to automate data extraction.

Business Intelligence
Visits 156.2KFavorites 136Likes 118
Financial Fusion
Freemium

Financial Fusion

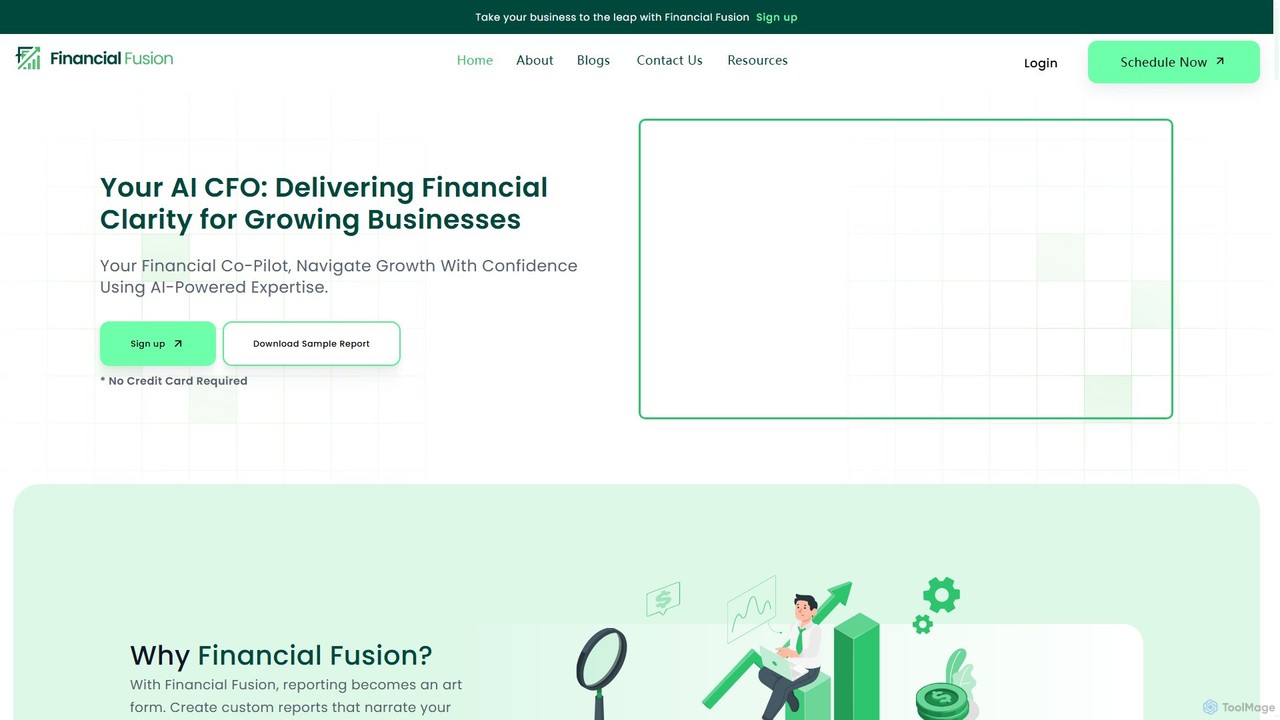
Financial Fusion is an AI-powered CFO platform that provides growing businesses with financial clarity. It analyzes profit & loss, balance sheets, and cash flow statements to generate easy-to-understand reports with actionable insights, trend analysis, and strategic recommendations, simulating the expertise of a seasoned CFO.

Analytics
Visits 7.3KFavorites 154Likes 168
Flowpoint
Freemium

Flowpoint

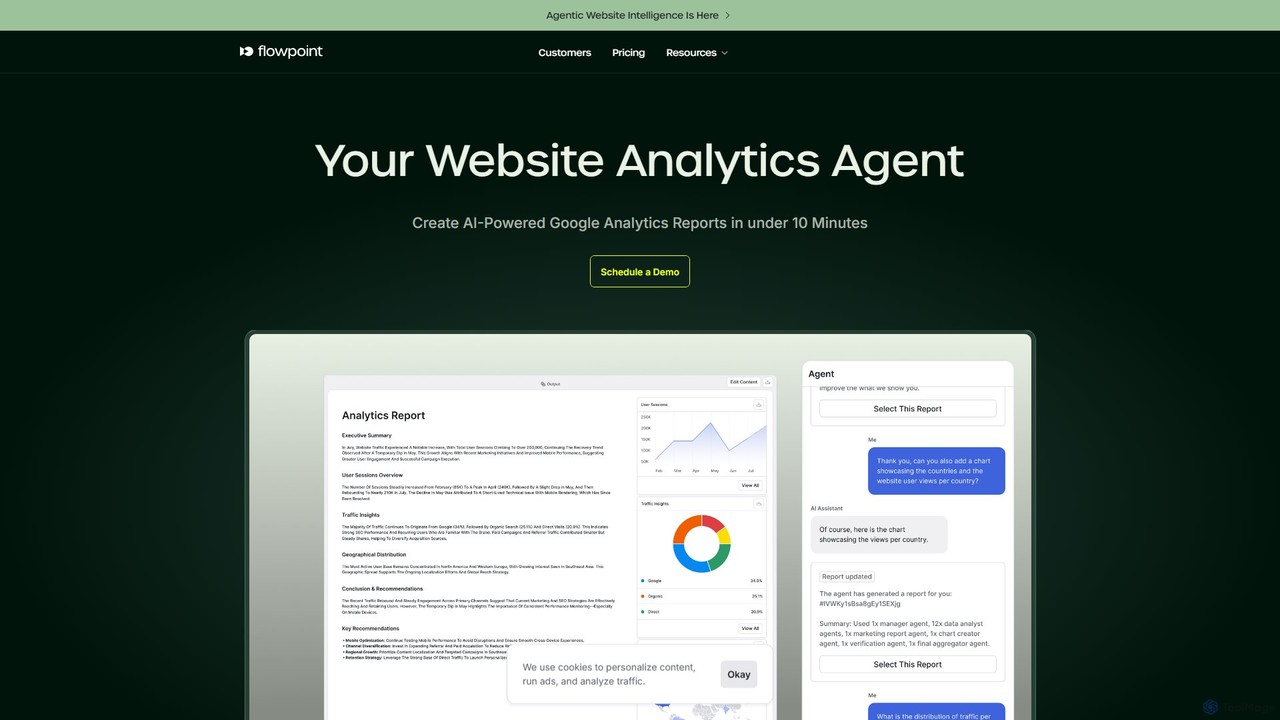
Flowpoint is an AI-powered agentic process builder designed for website intelligence. It automates website analytics by connecting to data sources like Google Analytics, using AI agents to analyze data and generate in-depth reports in minutes. This no-code platform empowers marketers to optimize website performance, improve ROI, and gain actionable insights without requiring technical expertise.

Website Analytics
Visits 52.1KFavorites 159Likes 149
Modeliks
Freemium

Modeliks

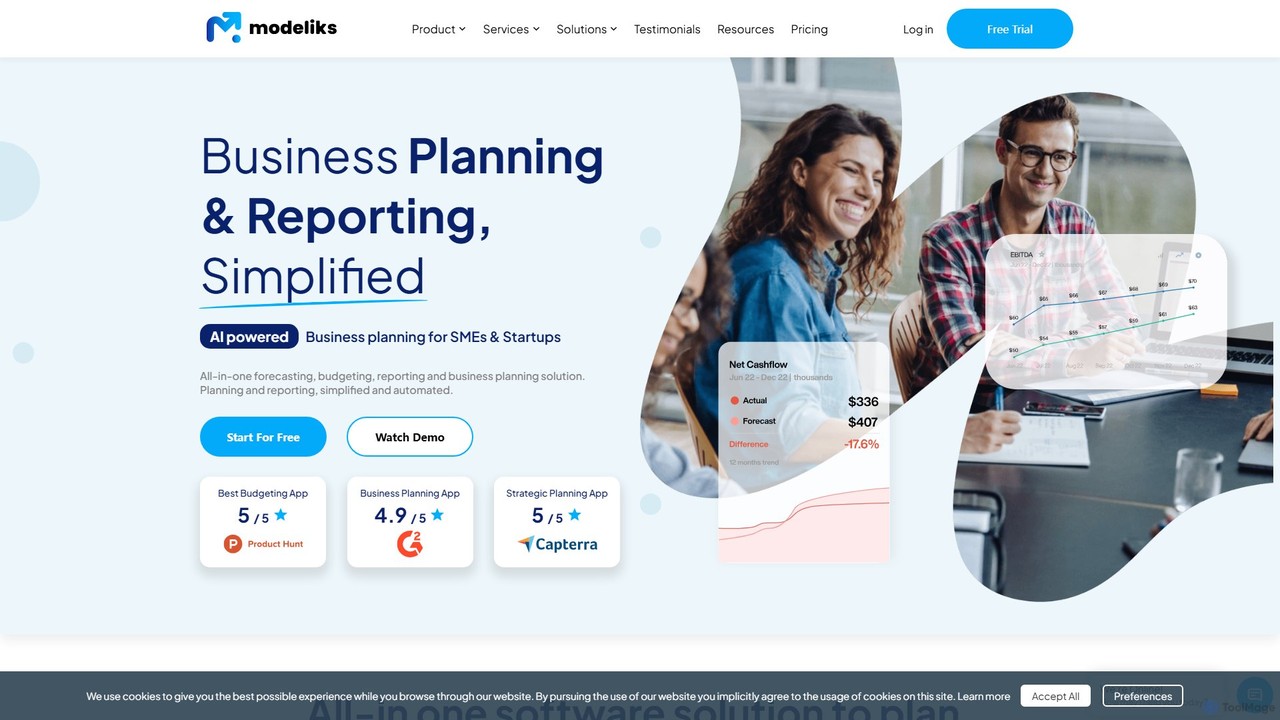
Modeliks is an AI-powered, all-in-one business planning software designed for entrepreneurs, startups, and SMEs. It simplifies financial forecasting, automates reporting, and generates professional business plans and investor-ready pitch decks, enabling users to plan, manage, and grow their business with data-driven confidence.

Business Planning
Visits 15.9KFavorites 131Likes 142
Kurby
Paid

Kurby

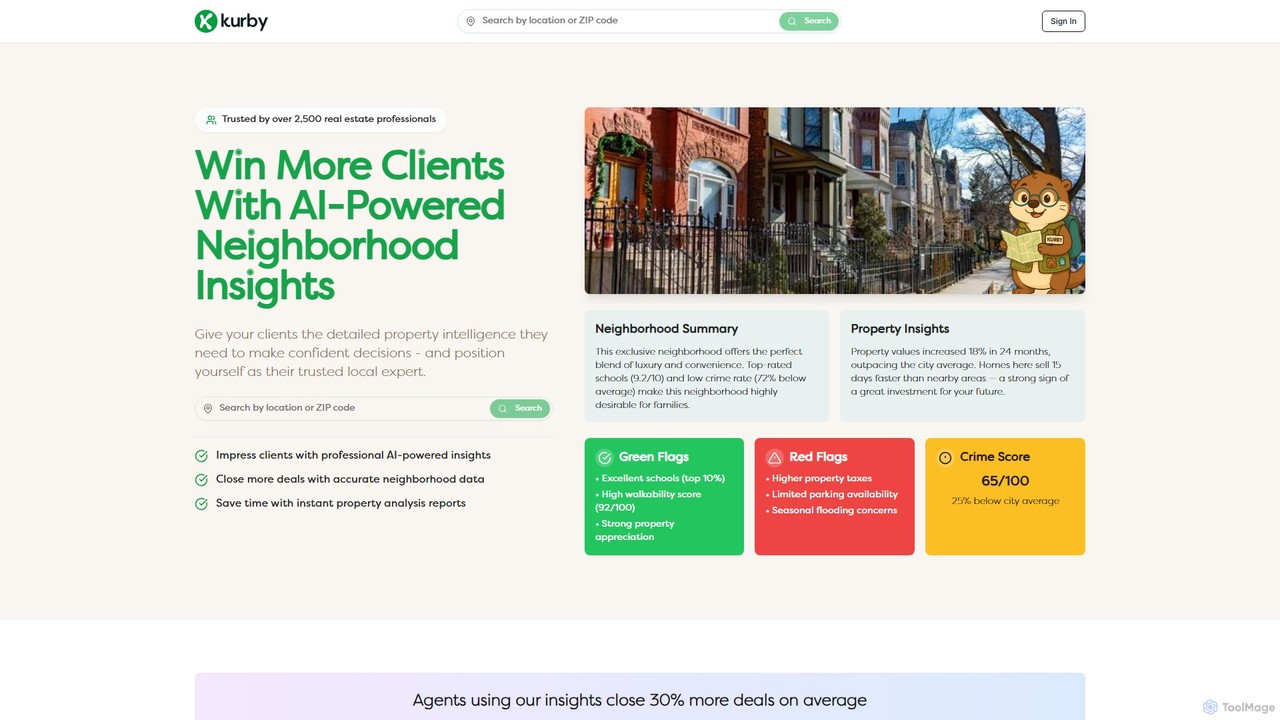
Kurby is an AI-powered platform for real estate professionals, providing detailed neighborhood and property intelligence. It generates comprehensive reports on market trends, demographics, safety, and amenities, helping agents impress clients, close more deals, and establish themselves as local experts.

Lead Generation
Visits 17.2KFavorites 140Likes 138
ASK BOSCO®
Paid

ASK BOSCO®

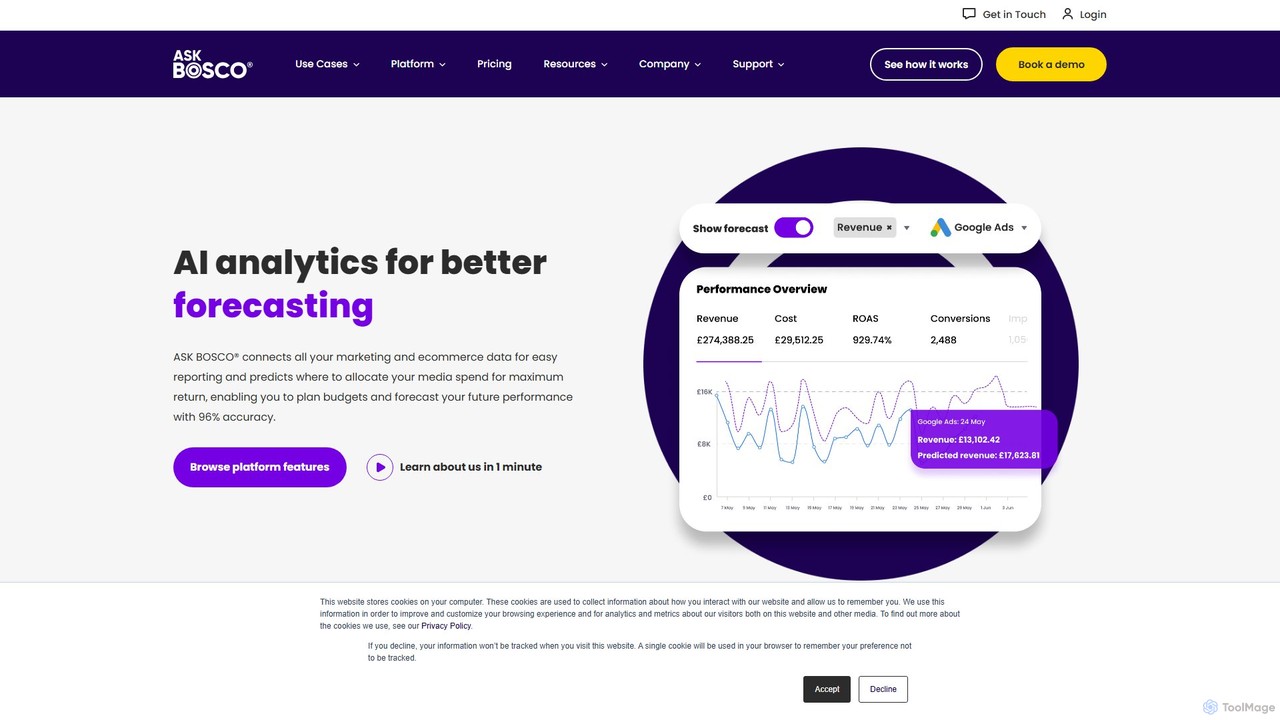
ASK BOSCO® is an AI-powered analytics platform for agencies and retailers, designed for advanced reporting, forecasting, and competitor benchmarking. It connects all your marketing and e-commerce data to predict optimal media spend allocation, enabling you to plan budgets and forecast future performance with up to 96% accuracy. Centralize data, automate reports, and make smarter, data-driven decisions to maximize your return on investment.

Forecasting
Visits 11.9KFavorites 125Likes 105
Analytics Model
Paid

Analytics Model

Analytics Model is a GenAI-powered conversational analytics platform that transforms your business data into expert insights instantly. Connect to over 500 data sources, ask questions in natural language, and create powerful, customizable visualizations to empower strategic decision-making and streamline your data processes.

Business Intelligence
Visits 7.4KFavorites 150Likes 142

About Reporting

AI Reporting tools are a class of software that automates the creation of data-driven reports and dashboards. They leverage machine learning and natural language generation (NLG) to analyze complex datasets, identify key trends, and translate insights into human-readable text. This enables businesses to quickly generate comprehensive sales reports, marketing analytics summaries, and financial statements without extensive manual effort. As a specialized area within Productivity, these tools focus specifically on transforming raw data into actionable narratives and visualizations, saving countless hours of analysis.

Core Features

  • Automated Data Integration: Connects to various sources like CRMs, analytics platforms, and databases to centralize information.
  • Natural Language Generation (NLG): Automatically writes textual summaries, explanations, and insights from data charts and tables.
  • Trend & Anomaly Detection: Proactively identifies significant patterns, outliers, or unexpected changes in data that require attention.
  • Interactive Dashboards: Creates dynamic, filterable visualizations that allow users to explore data from multiple angles.
  • Scheduled Distribution: Automates the generation and delivery of reports via email or other channels on a recurring basis.

Use Cases

AI Reporting tools are widely used by marketing managers to track campaign performance, financial analysts to generate monthly summaries, and sales leaders to monitor pipeline health. Operations teams also use them to report on key performance indicators (KPIs) across the business, providing consistent and timely updates to stakeholders without manual intervention.

How to Choose

When selecting an AI Reporting tool, consider the breadth of its data source integrations to ensure it connects with your existing systems. Evaluate the quality and customizability of its Natural Language Generation (NLG) capabilities. Also, assess the user-friendliness of the dashboard and report builder, and verify its security protocols for handling sensitive business data.

Featured tool rankings

Reporting use cases

1

Automate Weekly Sales Performance Reports

A sales manager needs to provide a weekly performance summary to the executive team. Instead of spending hours manually exporting data from the CRM and creating charts, they connect an AI reporting tool. The tool automatically pulls data on new leads, conversion rates, and revenue by region. Its Natural Language Generation (NLG) feature then writes a concise summary highlighting top-performing representatives and deals at risk. A comprehensive, professionally written report is automatically emailed to stakeholders every Monday morning, saving 4-5 hours of manual work each week.

2

Monitor Real-time Marketing Campaign ROI

A digital marketing team runs multiple ad campaigns across Google, Facebook, and LinkedIn. To track return on investment (ROI), they integrate all ad platforms into an AI reporting tool. The tool creates a unified dashboard showing key metrics like cost-per-click (CPC), click-through rate (CTR), and conversions in real-time. Its AI-powered anomaly detection feature sends an alert when a campaign's cost per acquisition suddenly spikes, allowing the team to investigate and optimize ad spend immediately, preventing wasted budget and improving overall campaign effectiveness.

3

Generate Monthly Financial Summaries for Stakeholders

A financial analyst is tasked with preparing monthly financial summaries for the board of directors. This process typically involves manually compiling data from accounting software and writing explanatory notes. By using an AI reporting tool connected to QuickBooks, the analyst automates this workflow. The AI analyzes profit & loss statements, cash flow, and balance sheets. It then generates a narrative report that not only presents the key figures but also explains significant variances against the budget in plain language, enabling stakeholders to quickly grasp the company's financial health.

4

Analyze Customer Support Ticket Trends

A customer support lead wants to understand common issues and team performance without manually sifting through thousands of tickets. They connect their helpdesk system, like Zendesk, to an AI reporting tool. The tool automatically categorizes tickets, analyzes resolution times, and tracks customer satisfaction scores. It generates a weekly dashboard that visually highlights recurring issue categories (e.g., 'billing problems,' 'login issues') and identifies agents with the highest satisfaction ratings. This provides actionable insights to improve support processes, create targeted help articles, and recognize top performers.

5

Track E-commerce Inventory and Sales Patterns

An e-commerce manager for a Shopify store needs to stay on top of sales trends and inventory levels. They use an AI reporting tool that integrates directly with their store's backend. The tool generates daily reports on best-selling products, low-stock items, and customer purchasing patterns. It can also forecast potential stockouts based on current sales velocity. This allows the manager to make proactive inventory decisions, optimize marketing campaigns around popular products, and avoid lost sales due to out-of-stock items, directly impacting revenue.

6

Streamline Project Management Progress Reporting

A project manager overseeing a complex project with multiple teams using tools like Jira and Asana struggles to create consistent status reports. By implementing an AI reporting tool, they can aggregate data on task completion, budget spend, and timeline adherence from all sources into one dashboard. The tool automatically generates a weekly project status report, complete with charts and a narrative summary highlighting bottlenecks and progress against milestones. This ensures stakeholders receive clear, consistent updates, freeing the project manager from hours of manual data compilation and report formatting.

Reporting FAQ

What are AI Reporting tools?

AI Reporting tools are applications that use artificial intelligence, particularly machine learning and natural language generation (NLG), to automate the process of creating data reports. Instead of just visualizing data, they analyze it to find trends, identify anomalies, and write human-like text summaries. This transforms raw data into easily understandable insights, dashboards, and narratives without requiring deep analytical skills from the user.

How do AI Reporting tools differ from traditional Business Intelligence (BI) tools?

Traditional BI tools (like Tableau or Power BI) excel at data visualization and allow users to manually explore data to find insights. AI Reporting tools build on this by adding a layer of automation. The key difference is the use of Natural Language Generation (NLG) to automatically write narrative summaries and explanations for the data. While BI tools provide the 'what' through charts, AI reporting tools also provide the 'so what' by explaining trends in plain text, reducing the manual interpretation required.

What are the key features to look for in an AI Reporting tool?

When choosing an AI Reporting tool, focus on these key features:

  • Data Connectivity: Ensure it can easily connect to all your essential data sources (e.g., CRM, Google Analytics, databases, spreadsheets).
  • NLG Quality: Evaluate the clarity, accuracy, and customizability of the generated text. The insights should be genuinely useful, not just generic statements.
  • Customization: The tool should allow you to customize dashboards, report templates, and the specific metrics you want to track.
  • Usability: Look for a user-friendly interface that allows non-technical team members to create and understand reports without extensive training.
Who can benefit from using AI Reporting tools?

A wide range of professionals can benefit from AI Reporting tools. Business analysts can automate routine reporting tasks to focus on deeper strategic analysis. Marketing managers can get quick, narrative summaries of campaign performance. Sales leaders can receive automated pipeline reports with key insights. Even executives and non-technical stakeholders can benefit from receiving clear, data-driven summaries that are easy to understand without needing to interpret complex charts.

Is it difficult to set up an AI Reporting tool?

Most modern AI Reporting tools are designed to be user-friendly and often feature no-code interfaces. The primary setup involves securely connecting your data sources, which is typically done through pre-built integrations or APIs. While advanced customizations might require some technical knowledge, the core process of connecting data and generating standard reports is generally accessible to business users, not just data scientists or developers. Many providers also offer onboarding support to guide you through the process.