ToolMage
Sign in
Eraser
Whiteboard ยท 873K monthly visits

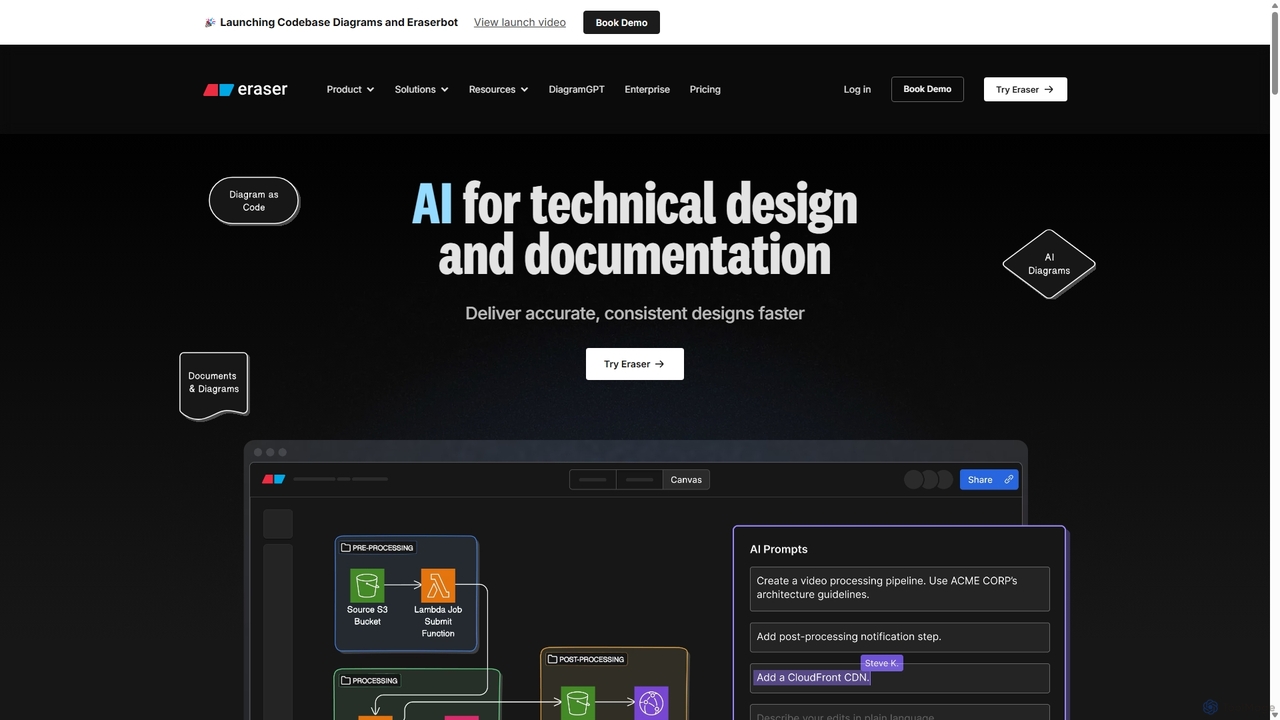
Eraser is an AI-powered co-pilot for technical design and documentation, built for engineering teams. It enables users to generate and edit diagrams like architecture, flowcharts, and ERDs using natural language prompts. It combines a collaborative canvas with a markdown editor and diagram-as-code functionality to streamline the entire design process, from brainstorming to documentation.

VS
Lucidchart
Project Management ยท 2.4M monthly visits

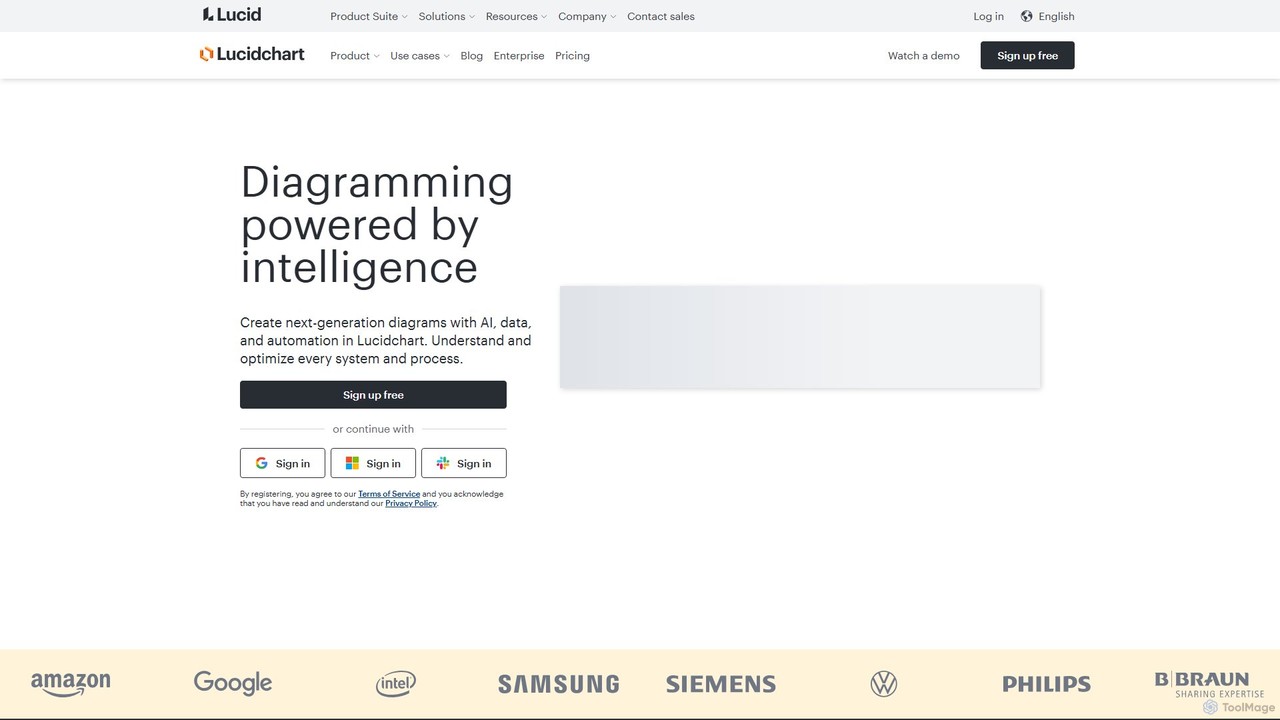
Lucidchart is an intelligent diagramming and visual collaboration platform that uses AI, data automation, and real-time teamwork to help users visualize complex systems, processes, and ideas. It enables teams to create professional flowcharts, org charts, network diagrams, and more, fostering clarity and driving innovation.

Eraser vs Lucidchart: pricing, features, traffic, and use cases

Compare Eraser and Lucidchart across positioning, pricing, traffic, and user feedback using structured factual data.

Updated Aug 20, 2026

Product overview

Eraser Product overview

Eraser is an AI-powered co-pilot for technical design and documentation, built for engineering teams. It enables users to generate and edit diagrams like architecture, flowcharts, and ERDs using natural language prompts. It combines a collaborative canvas with a markdown editor and diagram-as-code functionality to streamline the entire design process, from brainstorming to documentation.
Preview

Lucidchart Product overview

Lucidchart is an intelligent diagramming and visual collaboration platform that uses AI, data automation, and real-time teamwork to help users visualize complex systems, processes, and ideas. It enables teams to create professional flowcharts, org charts, network diagrams, and more, fostering clarity and driving innovation.

Preview

Detailed feature comparison

FeatureEraserLucidchart
Primary categoryWhiteboardProject Management
Added2025-09-122025-08-14
PricingFreemiumFreemium
Official websiteeraser.iowww.lucidchart.com
Product typeWebsiteWebsite
Performance data
User ratingNot verifiedNot verified
Comments00
Monthly visits873K2.4M
Monthly growth-16.3%-10.5%
Favorites97129
DetailsView detailsView details

Eraser vs Lucidchart monthly traffic

Compare Eraser and Lucidchart by monthly reach, traffic trend, visit depth, top regions, and acquisition sources.

How to interpret the traffic data

In the Eraser vs Lucidchart monthly traffic comparison, Eraser currently shows 873K visits and Lucidchart shows 2.4M; Lucidchart has about 2.7 times the visible traffic of Eraser, an absolute difference of about 1.5M visits. This reflects visible reach, not feature quality or paid users.

Both tools provide verified traffic details, so monthly trends, visit depth, regions, and acquisition sources can be compared on the same basis.

Lucidchart is registered at the www.lucidchart.com/pages subpage. Because the current data does not state whether other host pages are excluded, treat this as domain-level context rather than independent traffic for one product or project.

Eraser monthly traffic:

Latest traffic

Monthly visits
873K
Avg. visit duration
1:41
Pages per visit
3.71
Bounce rate
45.68%
Data updated 2026-06-15

Monthly traffic trend

  • 2025/9: 1.1M Monthly visits
  • 2026/1: 1.1M Monthly visits
  • 2026/2: 1.1M Monthly visits
  • 2026/3: 1.1M Monthly visits
  • 2026/4: 1M Monthly visits
  • 2026/5: 873K Monthly visits

Top regions

Top 5 countries/regions
Country/regionPercentageTraffic
๐Ÿ‡ฎ๐Ÿ‡ณIndia60.57%528.8K
๐Ÿ‡บ๐Ÿ‡ธUnited States17.39%151.8K
๐Ÿ‡ต๐Ÿ‡ญPhilippines8.22%71.8K
๐Ÿ‡ต๐Ÿ‡ฐPakistan7.51%65.6K
๐Ÿ‡ฟ๐Ÿ‡ฆSouth Africa6.31%55.1K

Traffic sources

Source typePercentageTraffic
Direct88.81%775.3K
Referral8.48%74K
Email2.71%23.7K

Search keywords

ai diagram generatorerasereraser aieraser ioeraser.io

Lucidchart monthly traffic:

Latest traffic

Monthly visits
2.4M
Avg. visit duration
0:38
Pages per visit
1.39
Bounce rate
72.55%
Data updated 2026-06-15

Monthly traffic trend

  • 2026/1: 2.2M Monthly visits
  • 2026/2: 2.4M Monthly visits
  • 2026/3: 2.8M Monthly visits
  • 2026/4: 2.6M Monthly visits
  • 2026/5: 2.4M Monthly visits

Top regions

Top 5 countries/regions
Country/regionPercentageTraffic
๐Ÿ‡บ๐Ÿ‡ธUnited States42.16%999.1K
๐Ÿ‡ฒ๐Ÿ‡ฝMexico17.72%419.9K
๐Ÿ‡จ๐Ÿ‡ดColombia16.67%395K
๐Ÿ‡ง๐Ÿ‡ทBrazil13.51%320.1K
๐Ÿ‡ต๐Ÿ‡ชPeru9.94%235.5K

Traffic sources

Source typePercentageTraffic
Direct81.99%1.9M
Referral16.95%401.7K
Email1.06%25.1K

Search keywords

diagrama de flujolucidlucid chartlucidchartmapa mental
Traffic-based selection guidance: Lucidchart is registered under a www.lucidchart.com subpath, so its large visible total may include the host platform. The current data does not justify choosing Lucidchart for traffic alone; shortlist by unique taxonomy and use case, then validate with the same tasks.

Usage comparison

Compare the core capabilities of Eraser and Lucidchart

Eraser Core features

Whiteboard
Diagramming
Documentation

Lucidchart Core features

Project Management
System Design
Collaboration
Diagramming

Use cases

Eraser Use cases

AI diagram
collaboration
diagramming
ERD
flowchart
cloud architecture
developer tool
diagram as code
engineering
sequence diagram
software architecture
technical documentation

Lucidchart Use cases

AI diagram
collaboration
diagramming
ERD
flowchart
data visualization
org chart
process mapping
project management
system design
UML

Best suited roles

Eraser Best suited roles

Data Analyst
DevOps Engineer
Engineering Manager
Product Manager
Software Architect
Software Developer
Systems Engineer
Technical Lead

Lucidchart Best suited roles

No verified data available

Eraser vs Lucidchart๏ผšIn-depth comparison and selection guidance

First decide whether the products solve the same kind of need

This in-depth Eraser vs Lucidchart comparison uses only the product records, taxonomy, audience, traffic, and community signals available on this page. Eraser is primarily listed under โ€œWhiteboardโ€, while Lucidchart is primarily listed under โ€œProject Managementโ€, so the first decision is whether your actual task matches their recorded scope.

The structured fields currently show these decision-relevant differences: Primary category (Eraser: Whiteboard; Lucidchart: Project Management); Monthly visits (Eraser: 873K; Lucidchart: 2.4M); Monthly growth (Eraser: -16.3%; Lucidchart: -10.5%); Favorites (Eraser: 97; Lucidchart: 129); Website (Eraser: eraser.io; Lucidchart: www.lucidchart.com). These facts are more useful for selection than brand visibility alone.

What market visibility and monthly traffic mean

In the Eraser vs Lucidchart monthly traffic comparison, Eraser currently shows 873K visits and Lucidchart shows 2.4M; Lucidchart has about 2.7 times the visible traffic of Eraser, an absolute difference of about 1.5M visits. This reflects visible reach, not feature quality or paid users.

Both tools provide verified traffic details, so monthly trends, visit depth, regions, and acquisition sources can be compared on the same basis.

Lucidchart is registered at the www.lucidchart.com/pages subpage. Because the current data does not state whether other host pages are excluded, treat this as domain-level context rather than independent traffic for one product or project.

Lucidchart is registered under a www.lucidchart.com subpath, so its large visible total may include the host platform. The current data does not justify choosing Lucidchart for traffic alone; shortlist by unique taxonomy and use case, then validate with the same tasks.

Product positioning, use cases, and roles

Eraser and Lucidchart currently overlap in shared tags: AI diagram, collaboration, diagramming, ERD, and flowchart. This can place both on the same shortlist, but it does not prove equal implementation, depth, or cost.

Eraser's unique categories/tags are Whiteboard, Diagramming, Documentation, cloud architecture, developer tool, diagram as code, engineering, and sequence diagram; Lucidchart's are Project Management, System Design, Collaboration, Diagramming, data visualization, org chart, process mapping, and project management. These unique fields are the strongest differentiators: validate the product whose recorded scope matches the task instead of following traffic alone.

What ratings, comments, and favorites can tell you

Eraser has no verified rating, 0 comments, 97 favorites, and 113 likes๏ผ›Lucidchart has no verified rating, 0 comments, 129 favorites, and 116 likesใ€‚

Neither product has enough rating or comment samples for a credible reputation ranking.

Selection guidance by actual need

When to evaluate Eraser first

Put Eraser on the priority trial list when the task aligns with โ€œWhiteboardโ€ and especially Whiteboard, Diagramming, Documentation, cloud architecture, developer tool, and diagram as code, or the users include Data Analyst, DevOps Engineer, Engineering Manager, and Product Manager. This follows recorded positioning and does not imply unlisted capabilities are absent.

Eraser also currently records: pricing is freemium, product type is website, 873K verified monthly visits, no verified user rating. Verify any hard requirement around price, platform, or reach before trial, and do not let sparse review data substitute for testing.

When to evaluate Lucidchart first

Put Lucidchart on the priority trial list when the task aligns with โ€œProject Managementโ€ and especially Project Management, System Design, Collaboration, Diagramming, data visualization, and org chart. This follows recorded positioning and does not imply unlisted capabilities are absent.

Lucidchart also currently records: pricing is freemium, product type is website, 2.4M monthly visits shown for the registered host (subpage scope unknown), no verified user rating. Verify any hard requirement around price, platform, or reach before trial, and do not let sparse review data substitute for testing.

How to validate the recommendation before deciding

The available data describes positioning, public visibility, and community signals, but it cannot prove output quality, speed, integration effort, privacy, or long-term cost in your workflow. Before deciding, run the same representative tasks in Eraser and Lucidchart, then record completion time, accuracy, manual corrections, and the real paid threshold. A like-for-like trial turns this comparison into a defensible adoption decision.

Comparison FAQ

How should I choose between Eraser and Lucidchart?
Compare positioning, pricing, taxonomy, and traffic maturity, then verify the latest details on each official website.
Where does this comparison data come from?
The factual baseline is derived from product, taxonomy, traffic, and community data. Reviewed editorial conclusions show their source and verification date.
What do unknown fields mean?
Unknown means there is not enough reliable evidence; the page does not fill gaps with assumptions.

Related AI tools

Cloudairy
Freemium

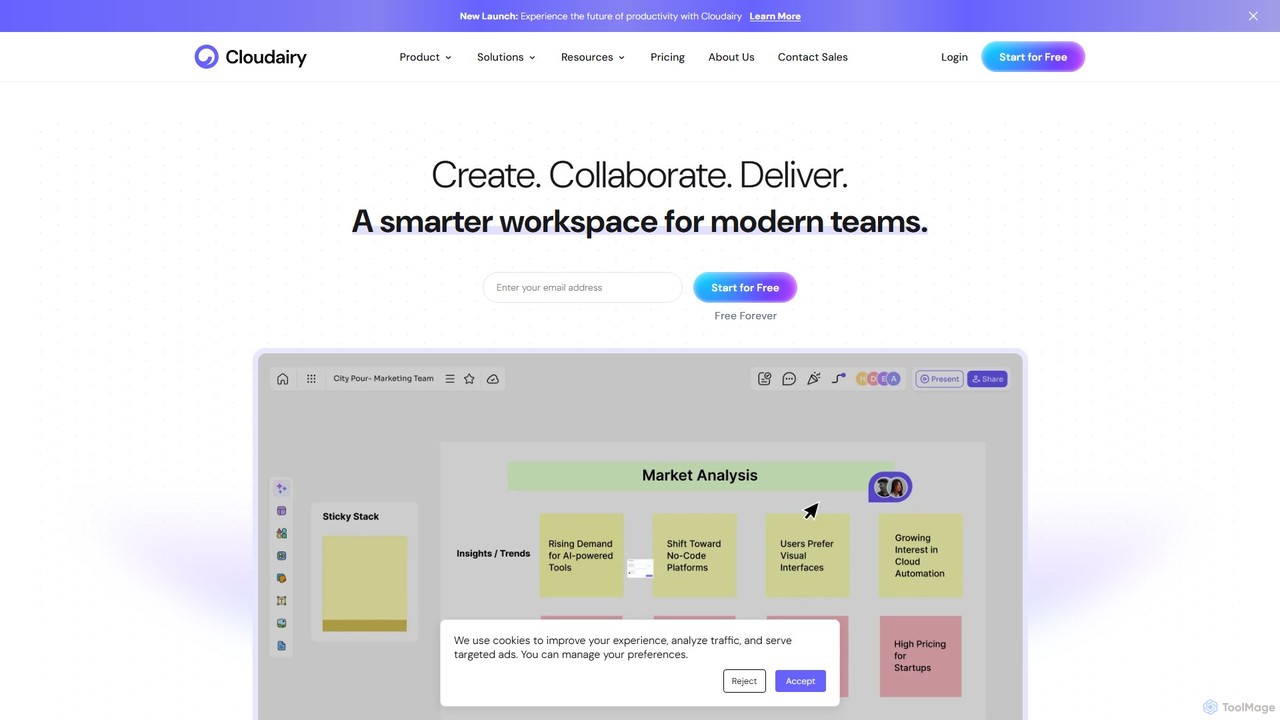
Cloudairy

Cloudairy is an AI-powered collaborative visual workspace designed for modern teams. It integrates AI-driven diagramming, mind mapping, image generation, and documentation tools into a single platform. It enables teams in engineering, sales, and project management to brainstorm, design, and deliver projects with enhanced efficiency and creativity.

Generative Art
Visits 166.1KFavorites 99Likes 85
Dezyn
Freemium

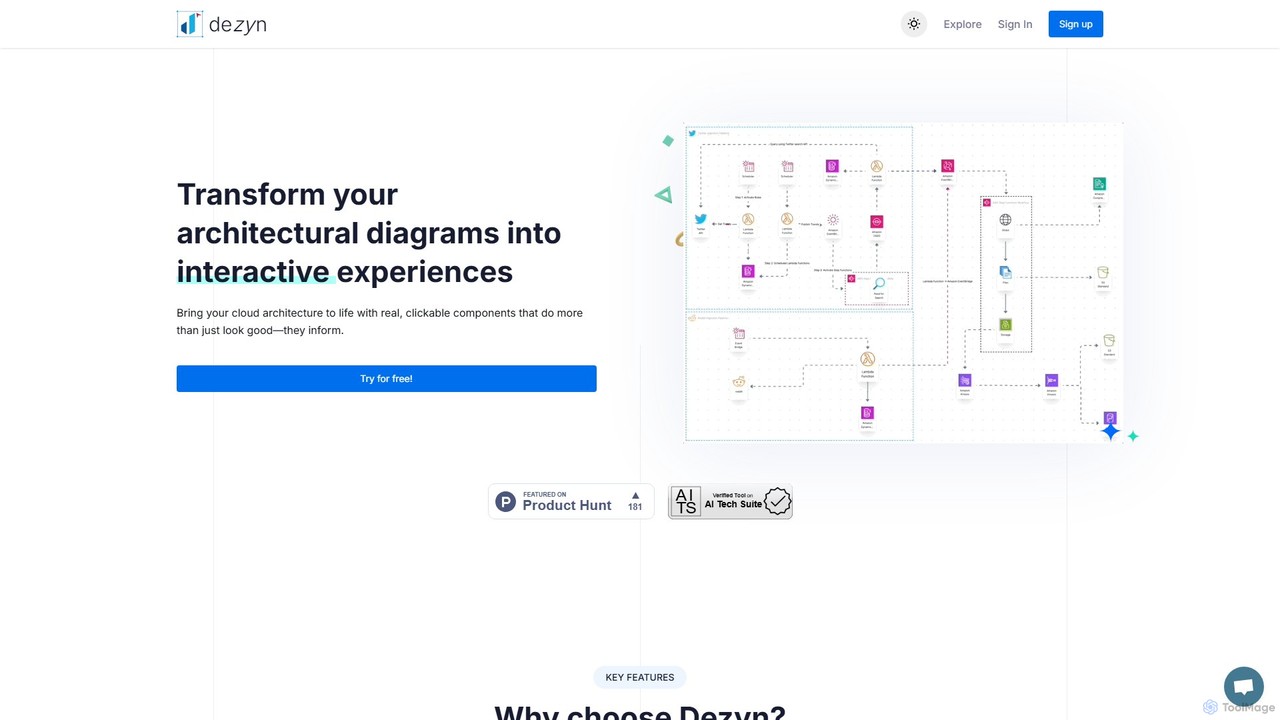
Dezyn

Dezyn is an AI-powered platform for creating interactive, data-rich architectural diagrams and flowcharts. It transforms text prompts, hand-drawn sketches, or wireframes into professional diagrams. Ideal for engineers, developers, and tech creators to visualize complex cloud systems (AWS, Azure, GCP) and collaborate effectively.

Flowchart
Visits 5KFavorites 103Likes 106
Mermaid Chart
Freemium

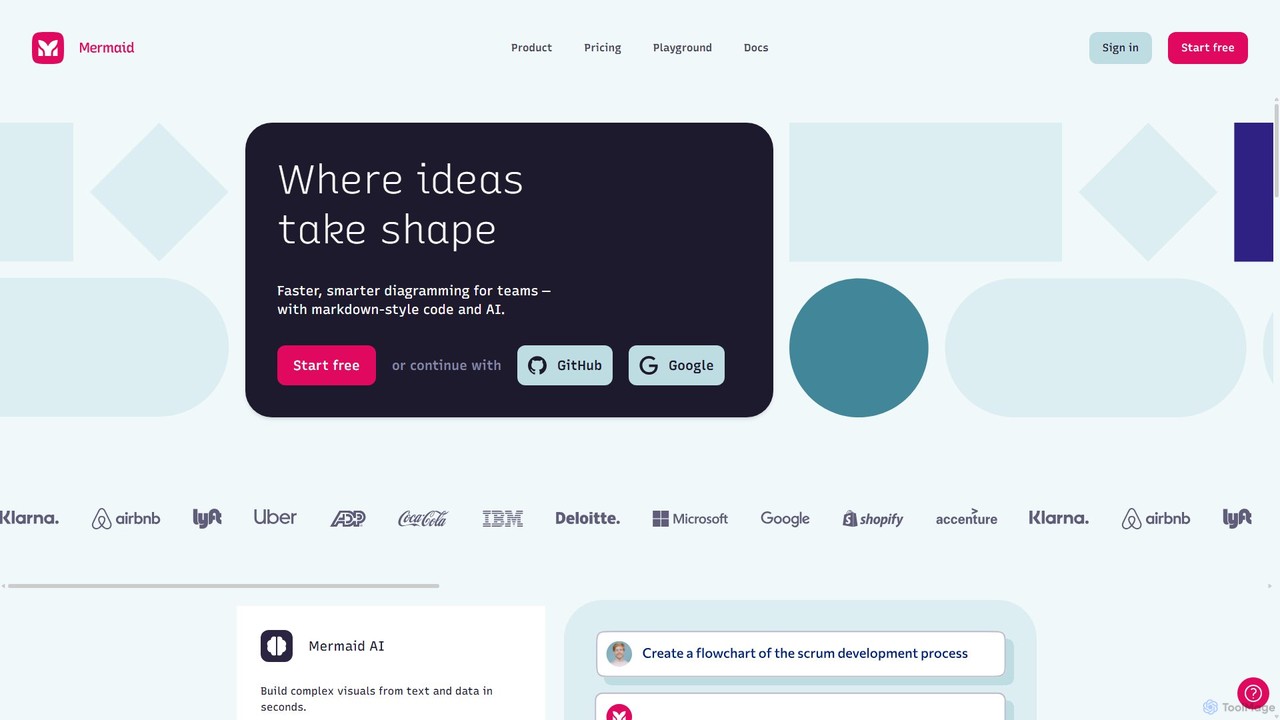
Mermaid Chart

Mermaid Chart is an AI-powered diagramming tool that enables teams to create complex visuals like flowcharts, sequence diagrams, and mind maps using markdown-style code, natural language prompts, or a visual editor. It's designed for faster, smarter diagramming and seamless collaboration.

Code Generation
Visits 6KFavorites 135Likes 121
Edrawsoft
Freemium

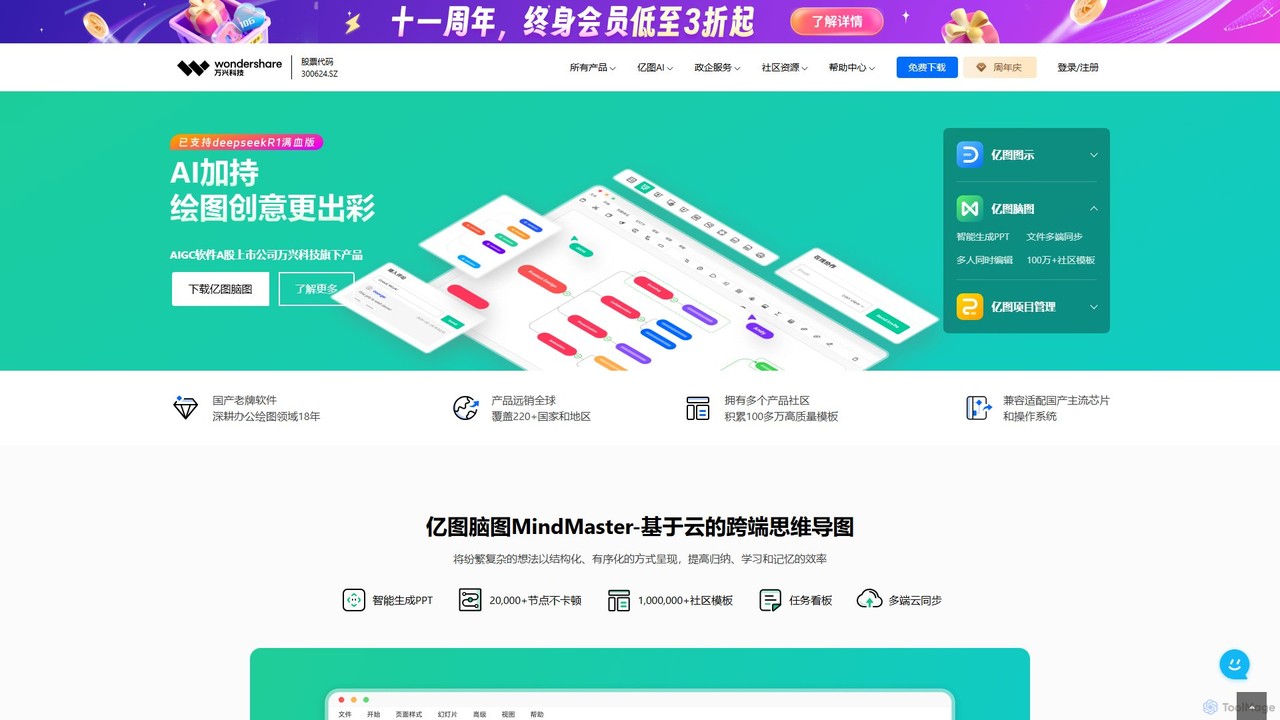
Edrawsoft

Edrawsoft is a comprehensive suite of AI-powered visual tools for diagramming, mind mapping, and project management. It includes EdrawMax for all-in-one diagram creation, EdrawMind for brainstorming, and EdrawProj for Gantt charts. With AI assistance, users can automatically generate flowcharts, org charts, and more from text, beautify designs with a single click, and collaborate seamlessly across platforms. It's a powerful Visio alternative for individuals, teams, and enterprises.

Project Management
Visits 4.4KFavorites 129Likes 130
Creately
Freemium

Creately

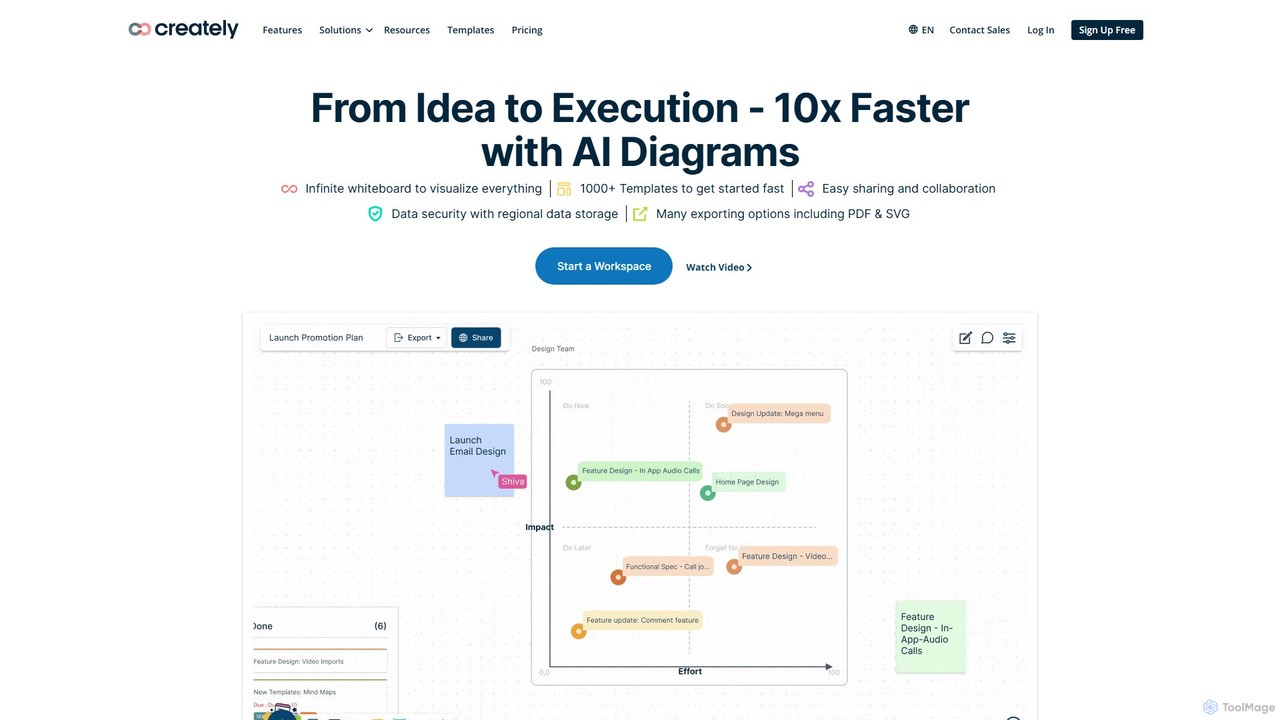
Creately is an AI-powered visual collaboration and work management platform. It combines intelligent diagramming, online whiteboarding, and data-driven project management on a single smart canvas, helping teams brainstorm, plan, and execute projects more effectively.

Planning
Visits 1MFavorites 117Likes 115
Mermaid Online
Paid

Mermaid Online

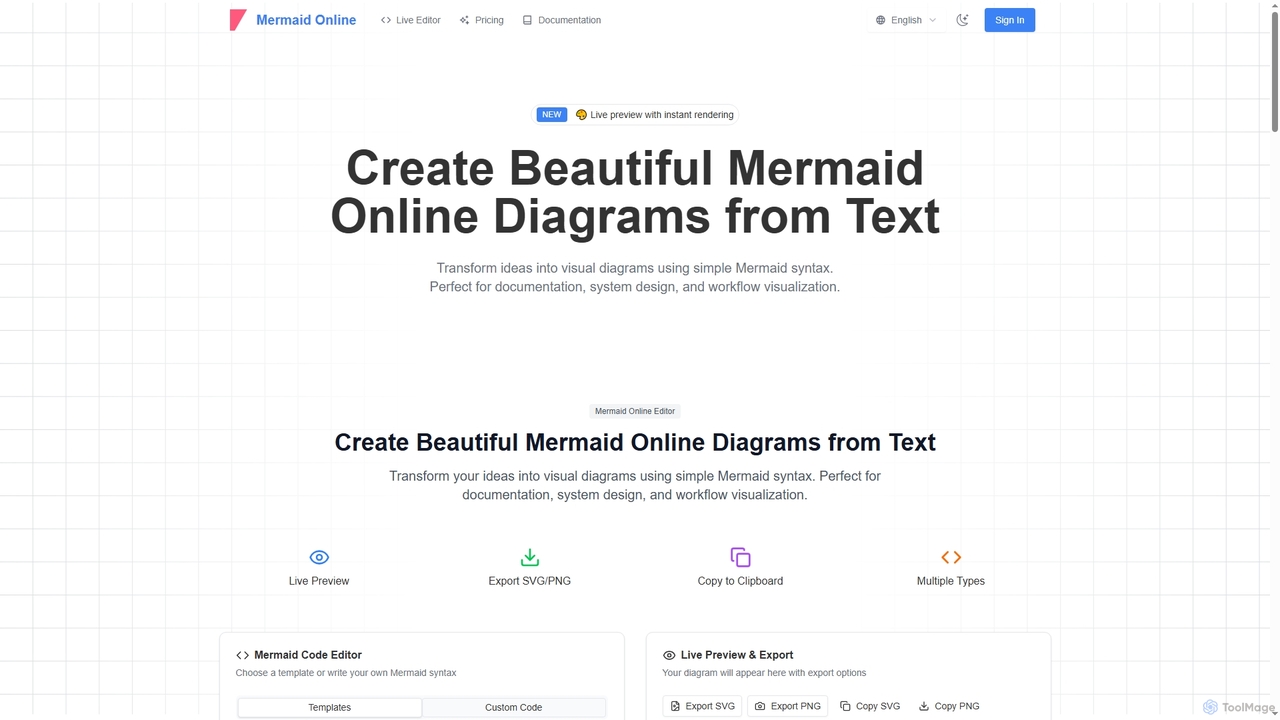
Mermaid Online is an advanced web-based editor and AI-powered diagram generator that transforms text descriptions and Mermaid syntax into professional visual diagrams. It supports various diagram types, offers real-time preview, and flexible export options, streamlining documentation and system design workflows for individuals and teams.

Text To Diagram
Visits 178KFavorites 104Likes 102
Whimsical
Freemium

Whimsical

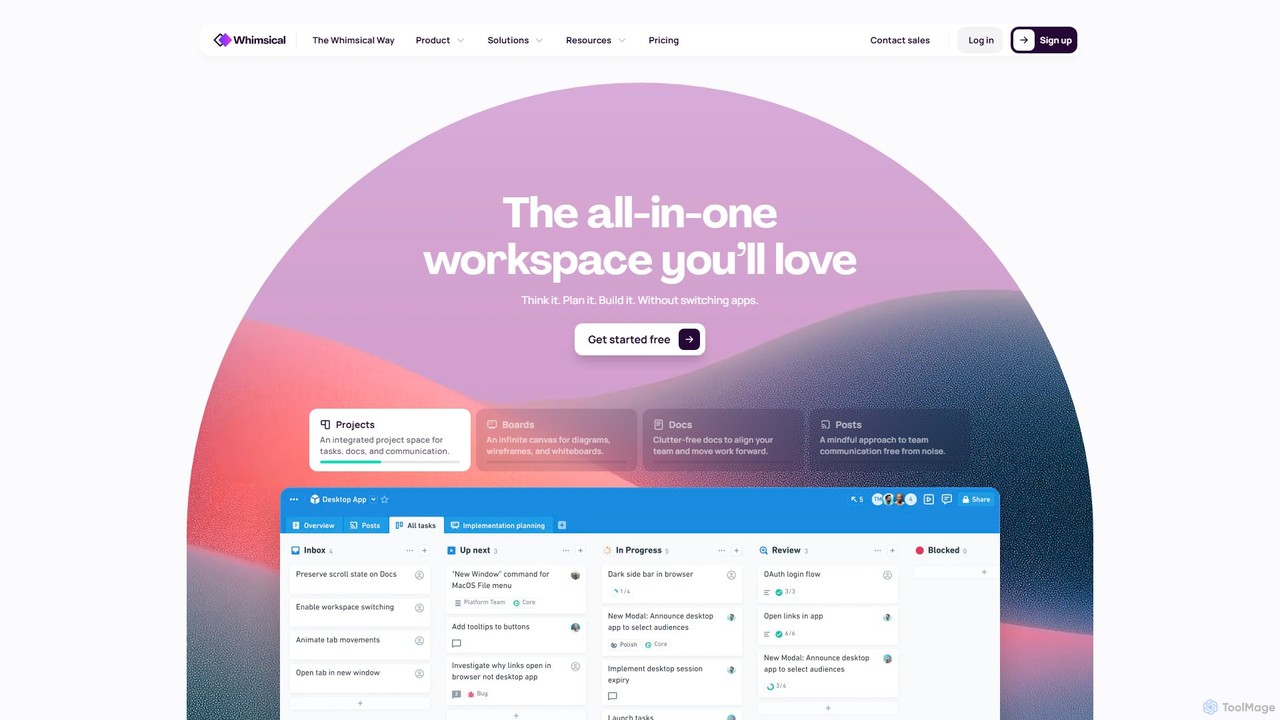
Whimsical is an all-in-one, AI-powered workspace that unifies visual collaboration, documentation, and project management. It combines whiteboards, mind maps, flowcharts, documents, and tasks to help teams streamline their entire workflow from initial idea to final execution in a single, interconnected platform.

Wireframing
Visits 1.4MFavorites 110Likes 122
Edraw.AI
Freemium

Edraw.AI

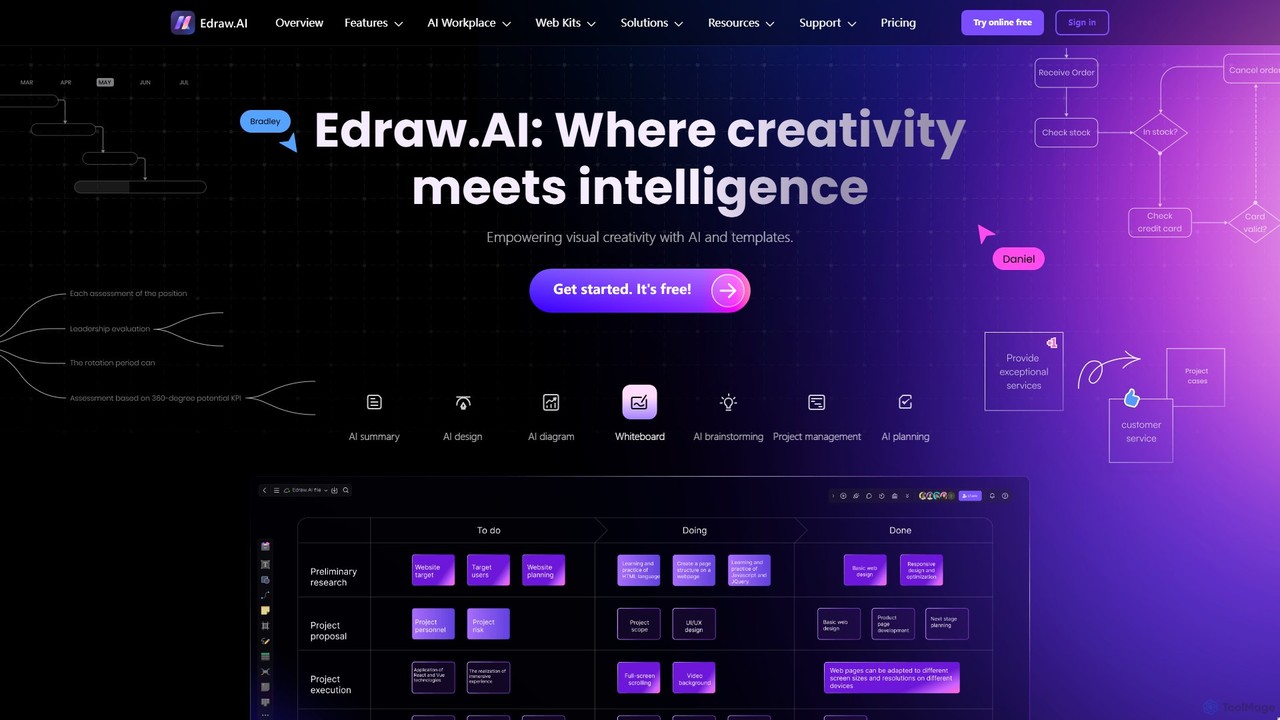
Edraw.AI is an AI-powered visual collaboration platform that enables users to create diagrams, mind maps, flowcharts, and other visuals with ease. It combines a user-friendly interface with powerful AI tools for generation, analysis, and design. Featuring real-time collaboration, an extensive library of templates and symbols, it's designed to boost productivity for teams in project management, IT, marketing, education, and more. Get started for free and transform your ideas into professional visuals.

Visualization
Visits 379.8KFavorites 109Likes 100
Sketch2scheme
Paid

Sketch2scheme

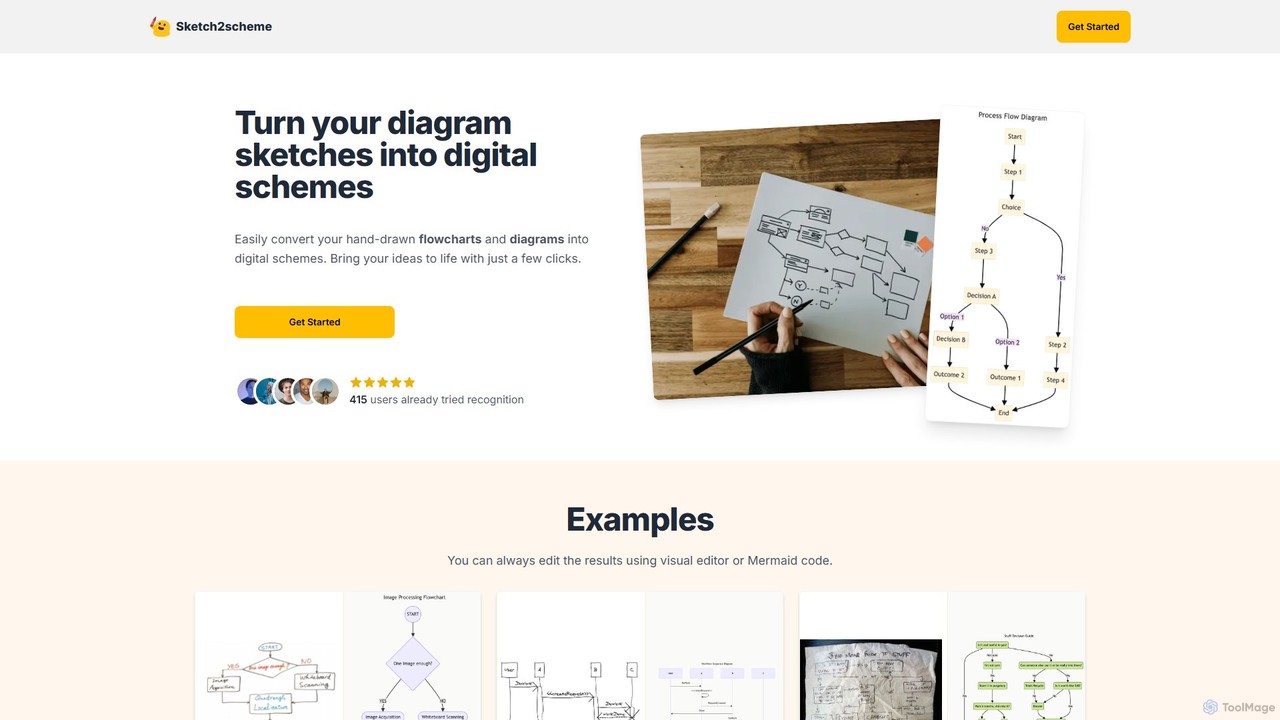
Sketch2scheme is an AI-powered tool that effortlessly converts your hand-drawn diagram sketches into polished, editable digital schemes. Simply upload a picture of your flowchart or diagram, and the AI will recognize nodes, connections, and text, transforming your analog ideas into digital assets in seconds. It's perfect for developers, project managers, and students who want to bridge the gap between paper brainstorming and digital implementation.

Prototyping
Visits 6.3KFavorites 151Likes 169
Miro
Freemium

Miro

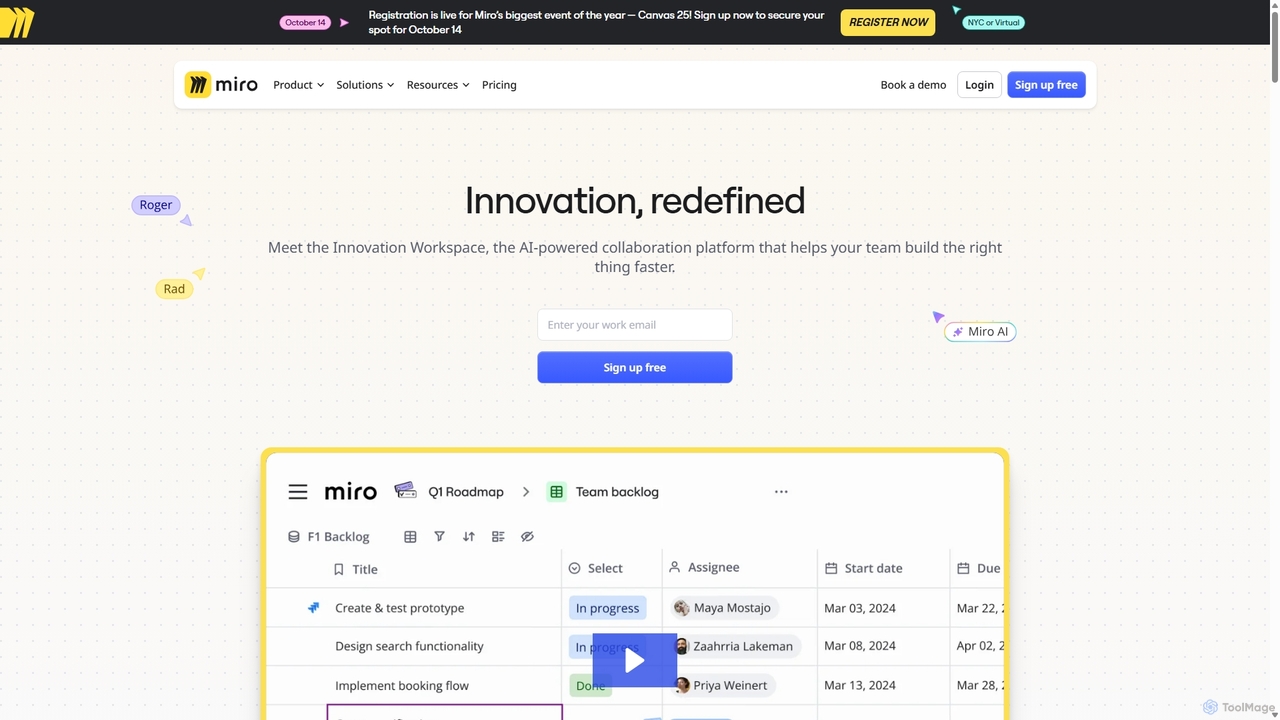
Miro is an AI-powered online collaborative whiteboard platform designed for modern teams. It provides an infinite canvas for brainstorming, planning, designing, and managing projects in real-time. With a vast template library, powerful integrations, and AI-driven features, Miro helps teams centralize communication and accelerate innovation from idea to execution.

Brainstorming
Visits 31MFavorites 112Likes 110
Jyek
AD

Jyek

Jyek is an AI agent platform that understands objectives, creates execution plans, uses tools, and delivers verifiable results for complex, multi-step tasks.

Automation
Visits 2.6KFavorites 4Likes 7
iMiaoban
Freemium

iMiaoban

iMiaoban is an AI-powered collaborative online whiteboard designed to enhance team productivity. It allows users to instantly create various diagrams, including flowcharts and mind maps, using text prompts. With a vast library of templates and real-time collaboration features, it simplifies the process of visualizing ideas and workflows.

Whiteboard
Visits 9KFavorites 122Likes 131
Airtable
Freemium

Airtable

Airtable is an AI-native app building platform for enterprises, combining the flexibility of a spreadsheet with the power of a database. It enables teams to create custom applications, automate complex workflows, and deploy intelligent AI agents without writing code, transforming critical data into actionable insights and streamlined operations.

Project Management
Visits 26.6MFavorites 134Likes 148
ChatUML
Freemium

ChatUML

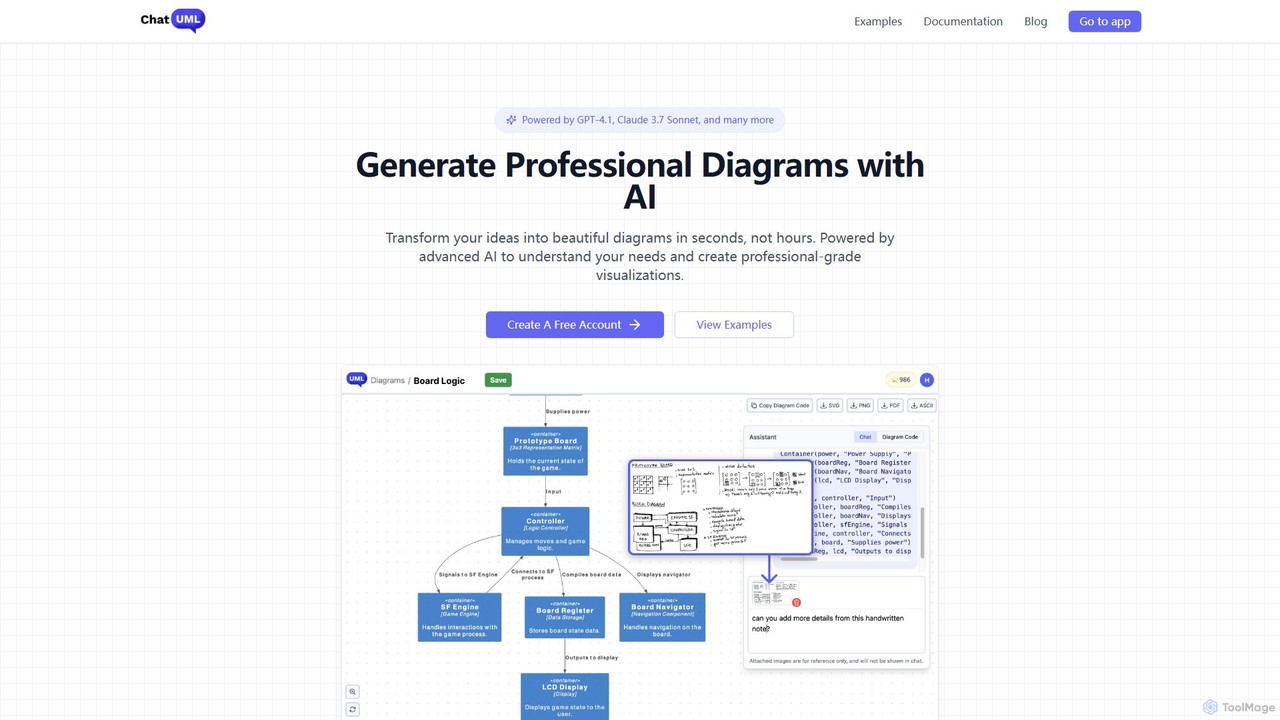
ChatUML is an AI-powered diagram generator that transforms text descriptions, hand-drawn sketches, and even website content into professional diagrams in seconds. Leveraging models like GPT-4.1 and Claude 3, it supports various formats including UML, C4 architecture, mind maps, and more, streamlining the visualization process for developers, project managers, and creative teams.

Planning
Visits 25.9KFavorites 107Likes 115
splotch
Freemium

splotch

splotch is an AI-powered diagramming tool that automatically converts written text, processes, and workflows into clear, editable flowcharts and diagrams. It features a unique two-way sync, ensuring your text and visuals are always aligned, streamlining communication and process documentation.

Process Management
Visits 5.1KFavorites 109Likes 104