ToolMage
Sign in

Best 38 Debugging AI tools for Developer Tools

Popular Debugging AI tools in Developer Tools include PostHog, Gemini Code Assist, Fullstory, OpenReplay, Zencoder, Refact, SessionStack, Raygun, Tembo, and Zipy, helping you work more efficiently.

OpenReplay
Freemium

OpenReplay

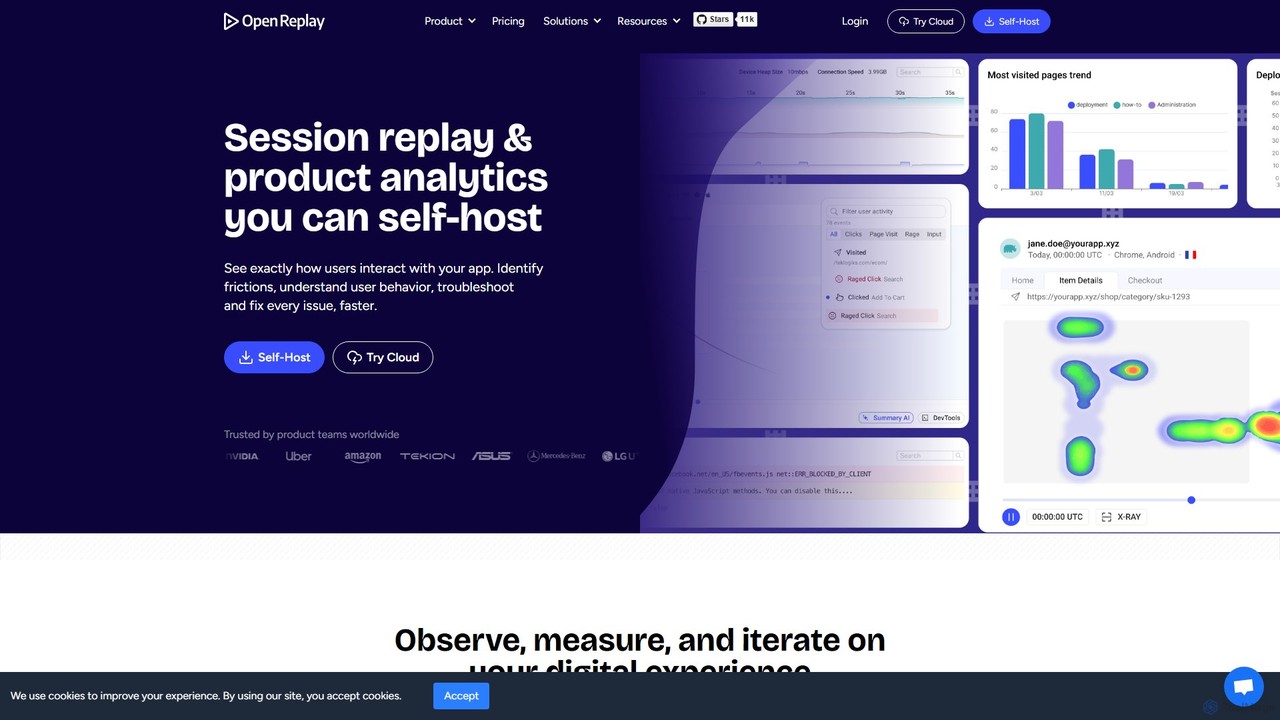
OpenReplay is a self-hostable, open-source session replay and product analytics suite. It empowers teams to understand user behavior, reproduce bugs faster, and optimize digital experiences. By providing visual context alongside technical data like console logs and network activity, OpenReplay helps engineers, product managers, and support teams identify frictions, improve conversion funnels, and enhance overall product usability while maintaining full control over customer data.

Live Chat
Visits 316.4KFavorites 142Likes 142
Otto Engineer
Freemium

Otto Engineer

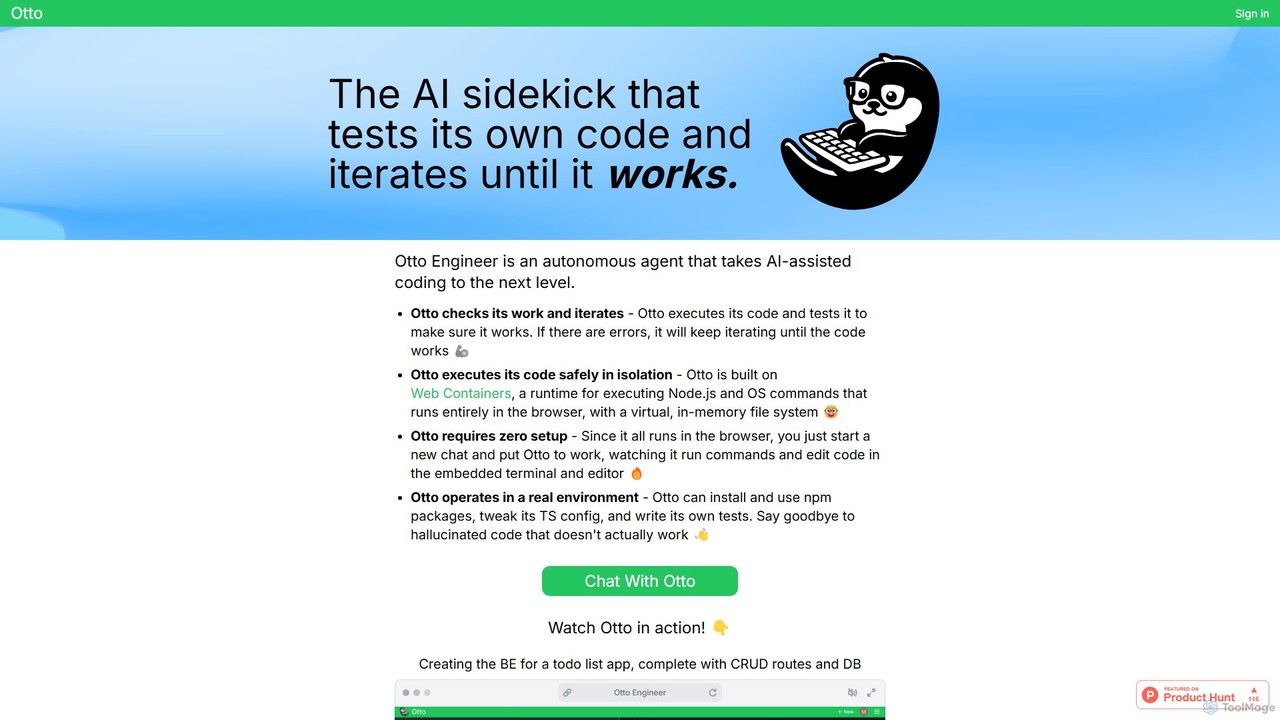
Otto Engineer is an autonomous AI agent that elevates coding by writing, testing, and iterating on code directly in your browser. It operates in a secure, sandboxed environment, requiring zero setup to prototype applications, debug complex issues, and generate reliable, working code.

Code Assistant
Visits 4.1KFavorites 134Likes 139
Human Behavior Co. Session Replay
Paid

Human Behavior Co. Session Replay

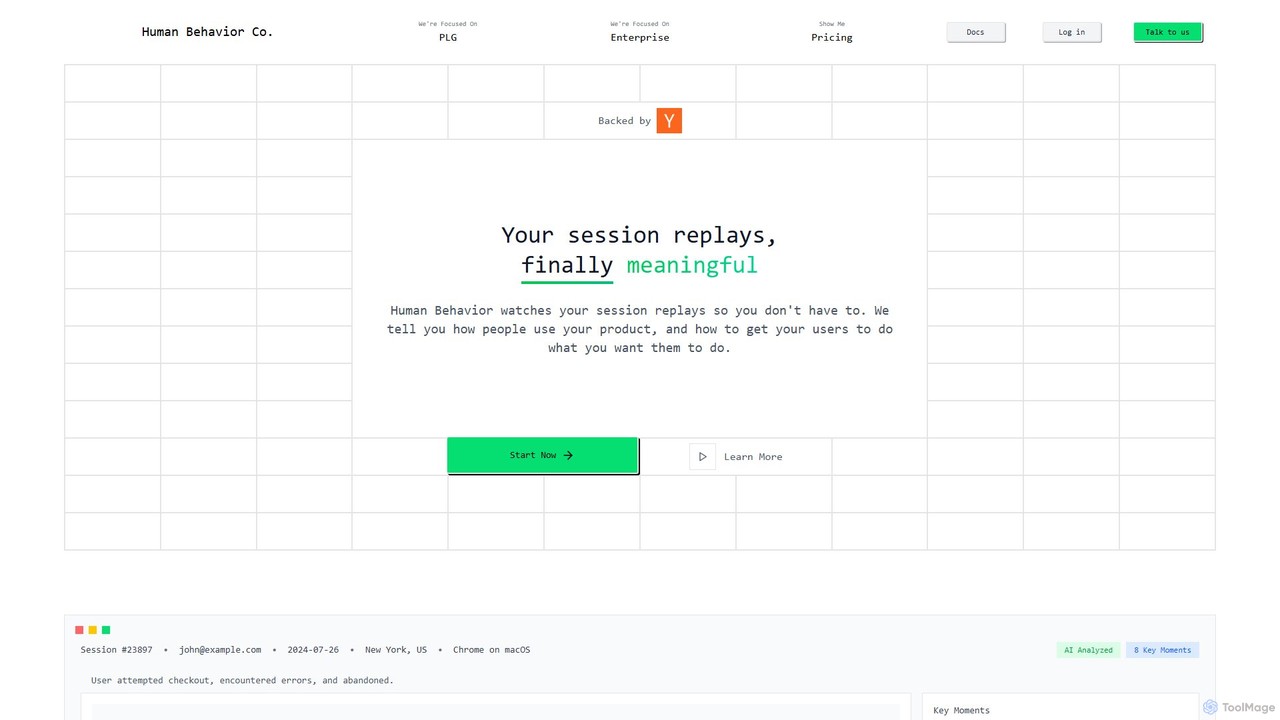
Human Behavior Co. is an AI-powered analytics platform that automatically watches and analyzes user session replays. It identifies key moments, uncovers behavior patterns, and provides actionable insights to help product teams optimize user journeys, improve feature adoption, and reduce churn without manual effort.

User Behavior
Visits 7.3KFavorites 92Likes 89
Refact
Freemium

Refact

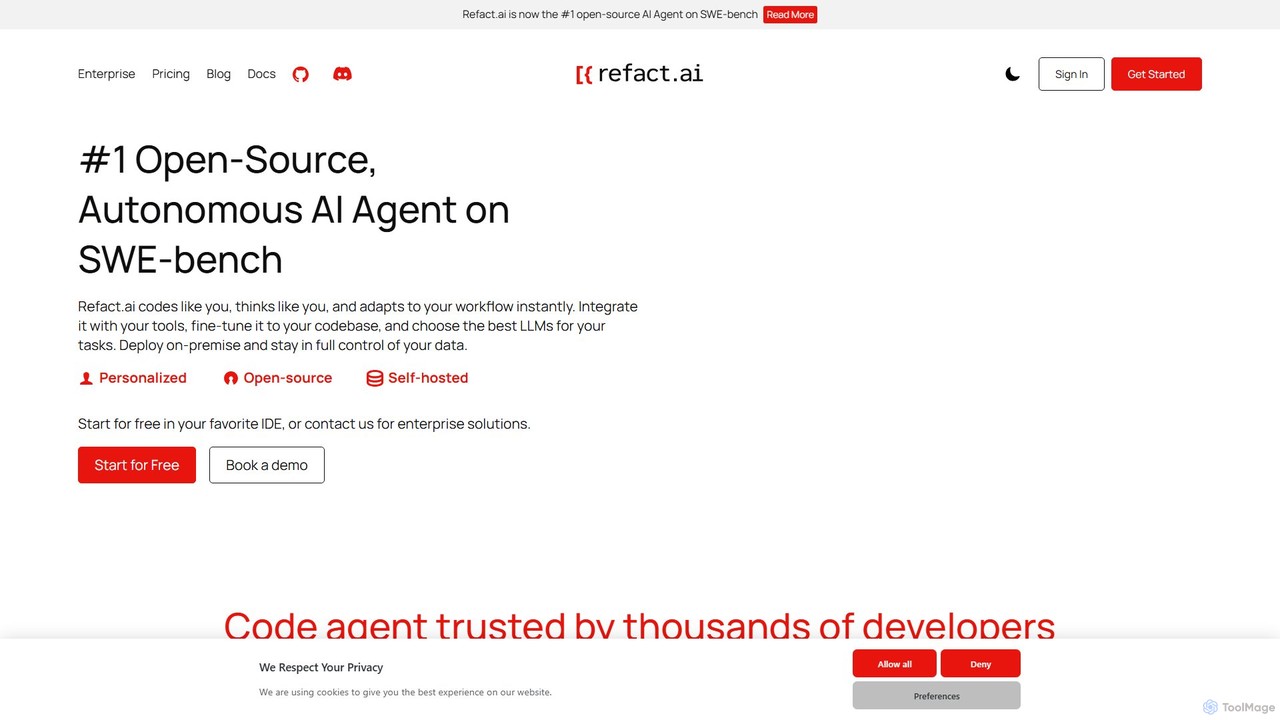
Refact is an open-source, self-hostable, and autonomous AI coding agent. It integrates into your IDE to act as a digital twin, automating coding tasks, providing context-aware completions and chat, and adapting to your codebase for maximum productivity and data privacy.

Code Assistant
Visits 116.2KFavorites 99Likes 101
Goast.ai
Freemium

Goast.ai

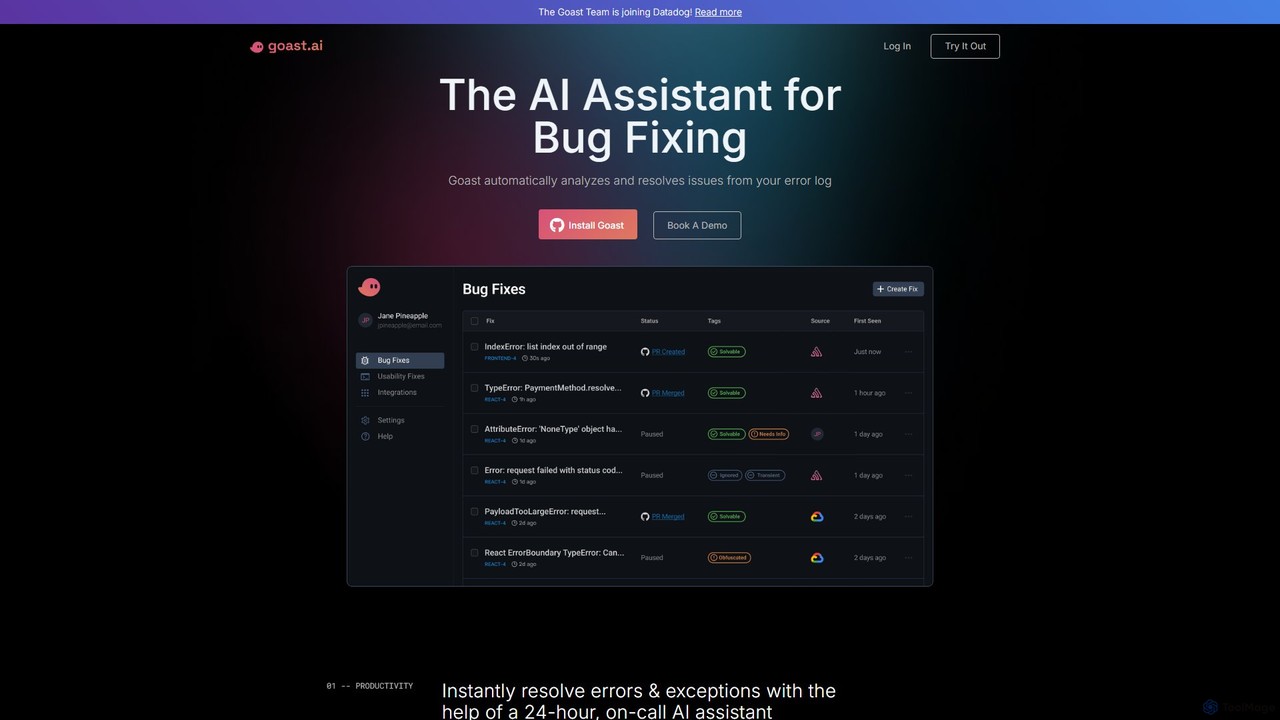
Goast.ai is an AI-powered assistant designed for engineering teams to automate bug fixing. It analyzes error logs, identifies the root cause, and automatically generates pull requests with code fixes, significantly speeding up the resolution process. NOTE: The Goast.ai team has been acquired by and joined Datadog.

Code Review
Visits 7.1KFavorites 102Likes 119
Tembo
Freemium

Tembo

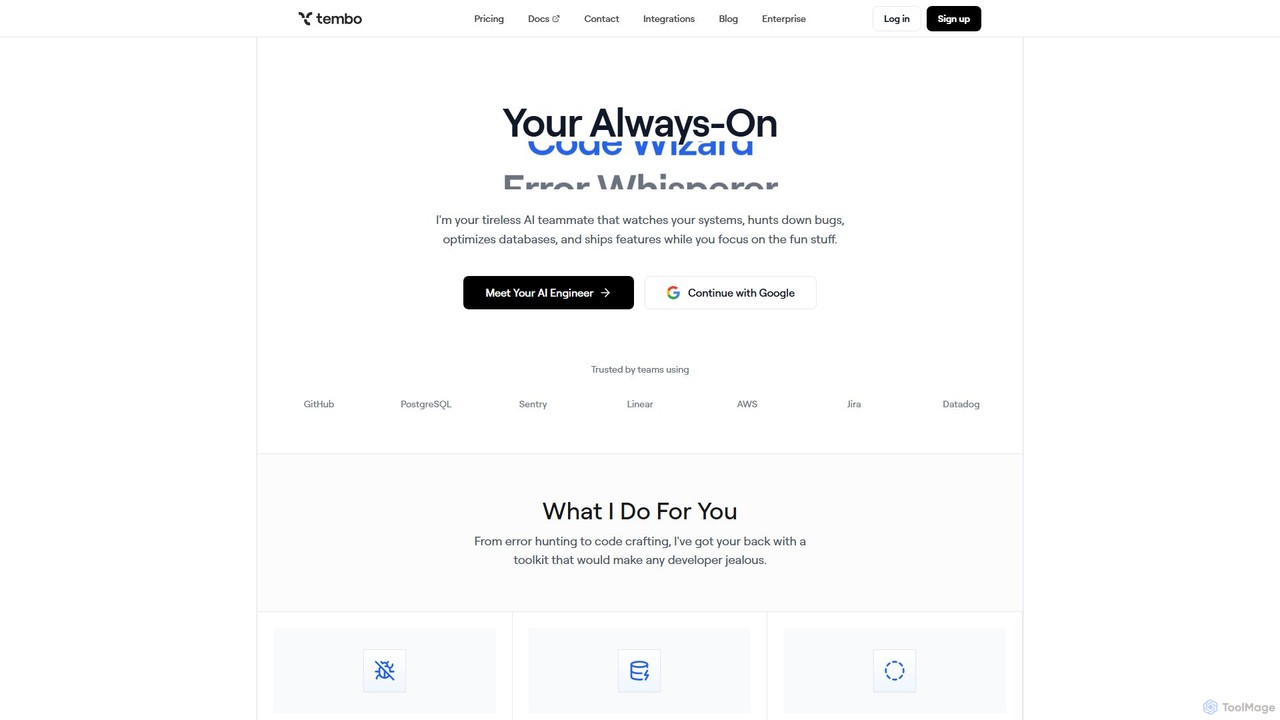
Tembo is an asynchronous AI software engineer designed to automate critical development tasks. It acts as a tireless AI teammate, monitoring systems, fixing bugs, optimizing databases, and converting tickets into code, allowing engineering teams to focus on building new features and increasing velocity.

Code Assistant
Visits 64KFavorites 95Likes 103
riyo.ai
Freemium

riyo.ai

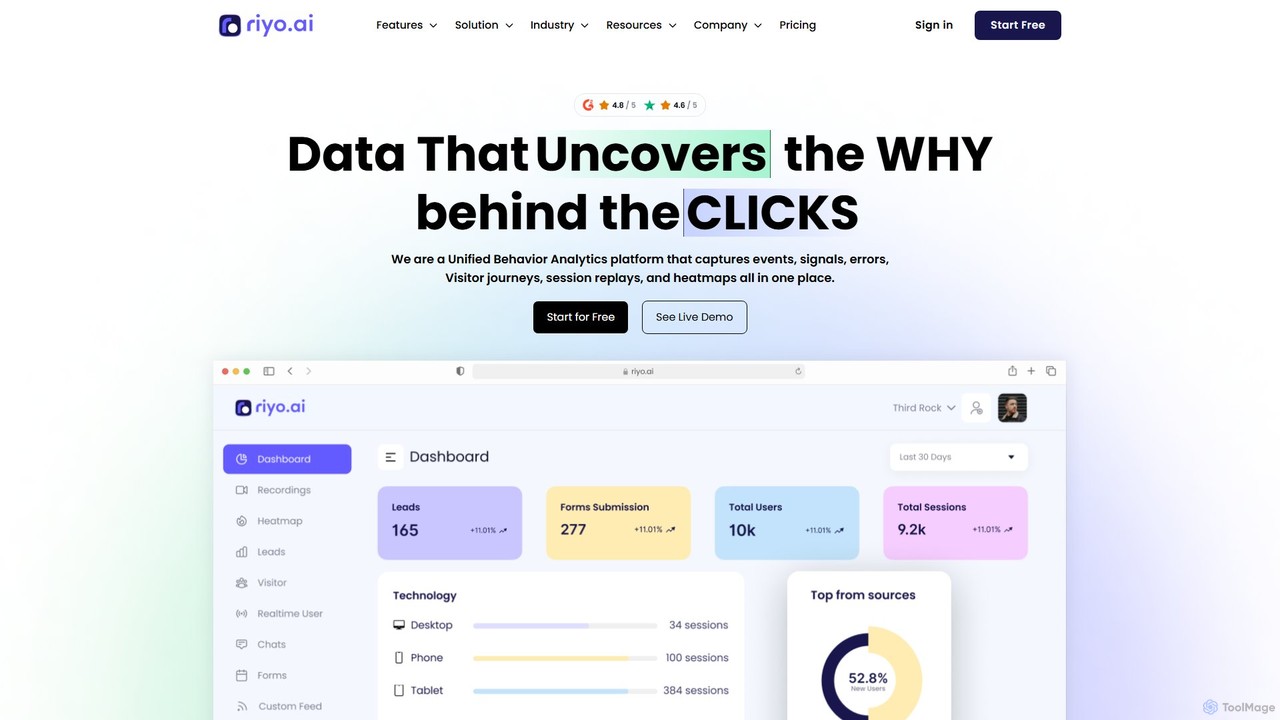
riyo.ai is a unified behavior analytics platform that combines session replays, heatmaps, error tracking, and product analytics. It helps businesses understand user behavior, optimize the customer journey, and increase conversion rates by revealing the 'why' behind every click.

Behavioral Analytics
Visits 5.5KFavorites 93Likes 92
Fullstory
Freemium

Fullstory

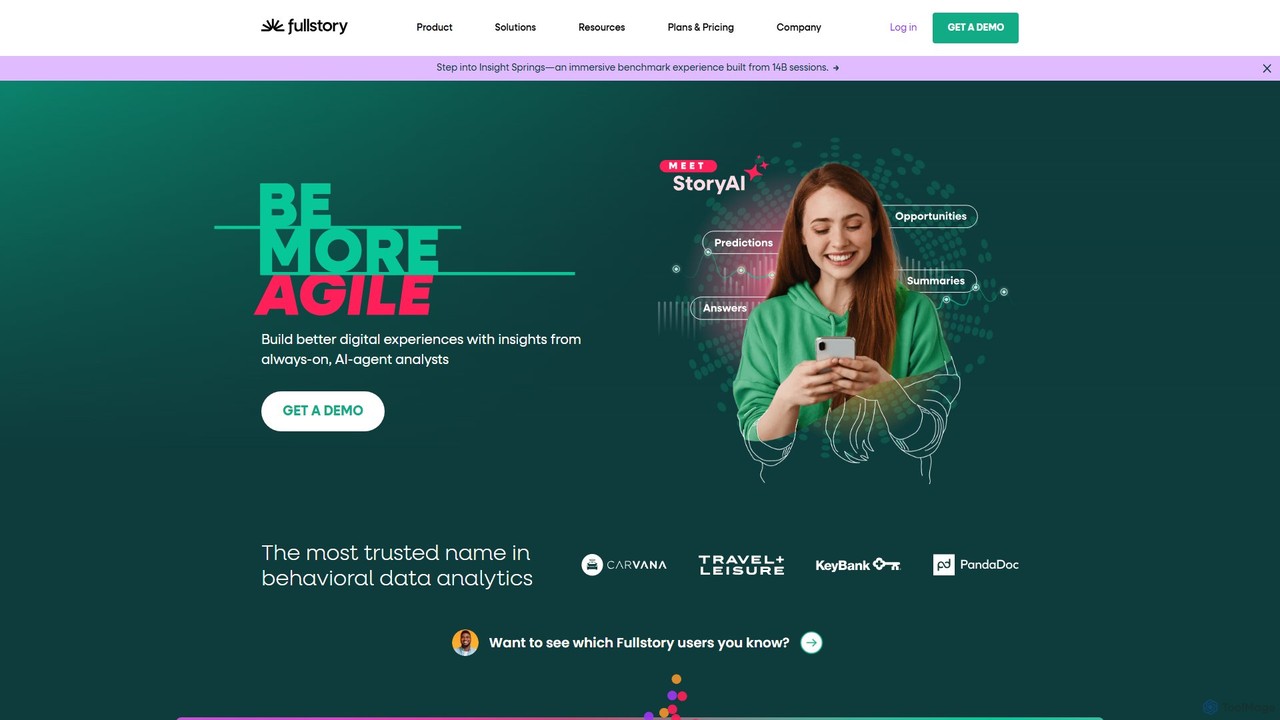
Fullstory is a leading Digital Experience Intelligence (DXI) platform that helps businesses understand and improve their user experience on web and mobile. It captures every click, scroll, and interaction, providing session replays, heatmaps, and AI-powered analytics to identify user friction, uncover bugs, and optimize conversion funnels.

User Behavior Analytics
Visits 335.1KFavorites 99Likes 98
Forking Path
Freemium

Forking Path

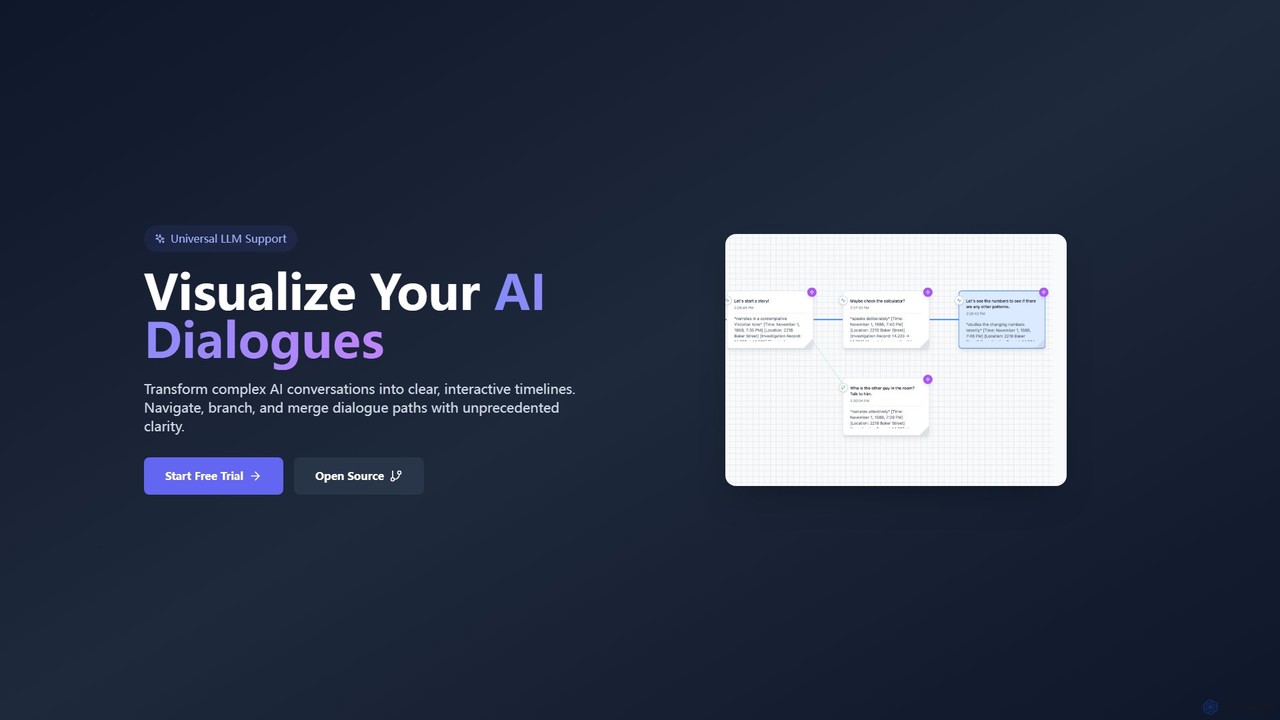
A developer-centric platform for visualizing, managing, and debugging complex AI conversations. Transform text logs into interactive, branching timelines to streamline development and enhance clarity for any Large Language Model (LLM).

Model Management
Visits 3.4KFavorites 107Likes 108
Kilo Code
Freemium

Kilo Code

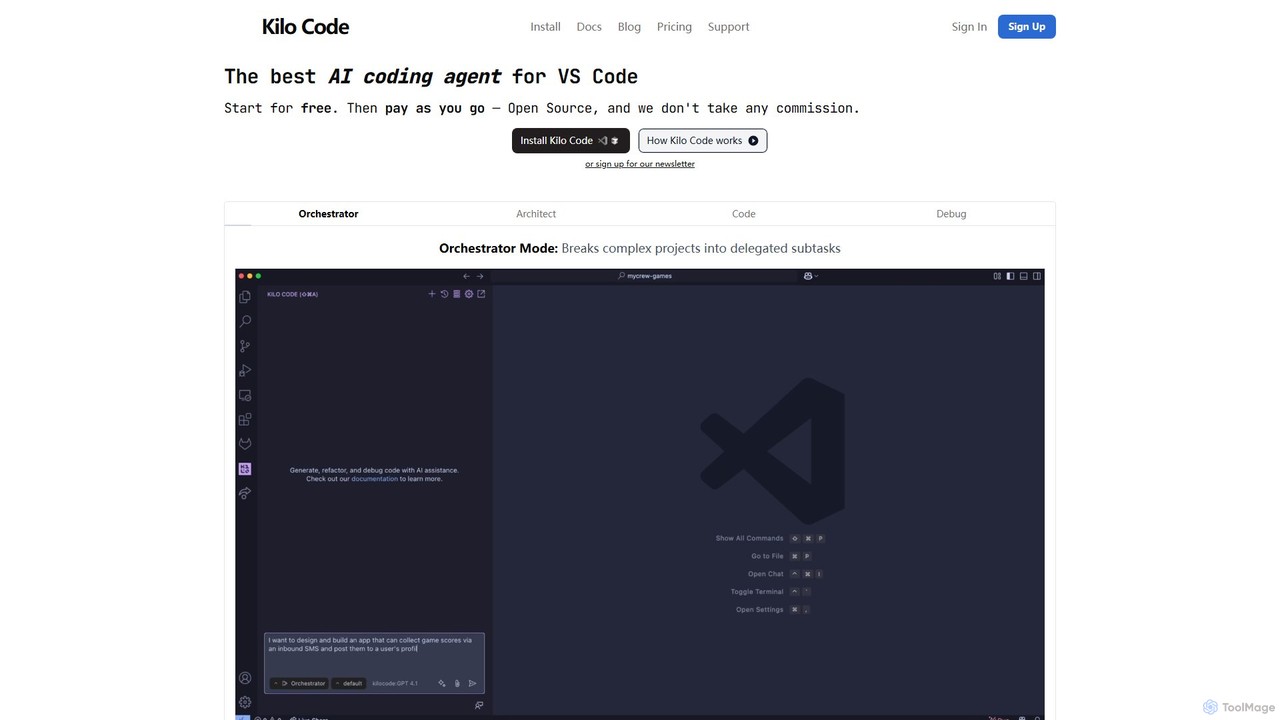
Kilo Code is a powerful, open-source AI coding agent for VS Code. It features a multi-agent system (Orchestrator, Architect, Code, Debug) to automate complex development tasks, from design to debugging. It's highly customizable, context-aware, and prioritizes user privacy with a "bring your own key" model and no data training.

Code Assistant
Visits 13.9KFavorites 86Likes 86
AIDE
Freemium

AIDE

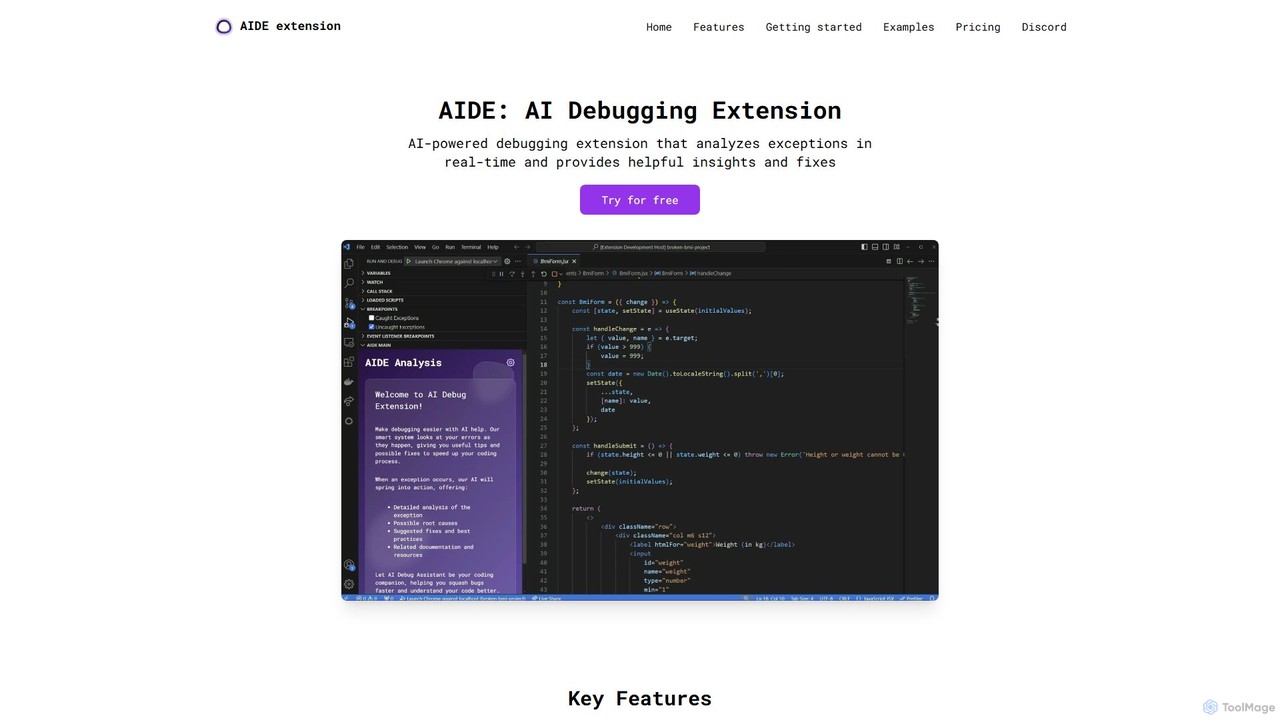
AIDE is an AI-powered debugging extension for VS Code that automatically analyzes errors, identifies their root causes, and suggests concrete code solutions. It streamlines the development workflow by providing instant, context-aware fixes for common issues in JavaScript, React, and more, directly within your editor.

Code Quality
Visits 4KFavorites 111Likes 114
Laminar
Freemium

Laminar

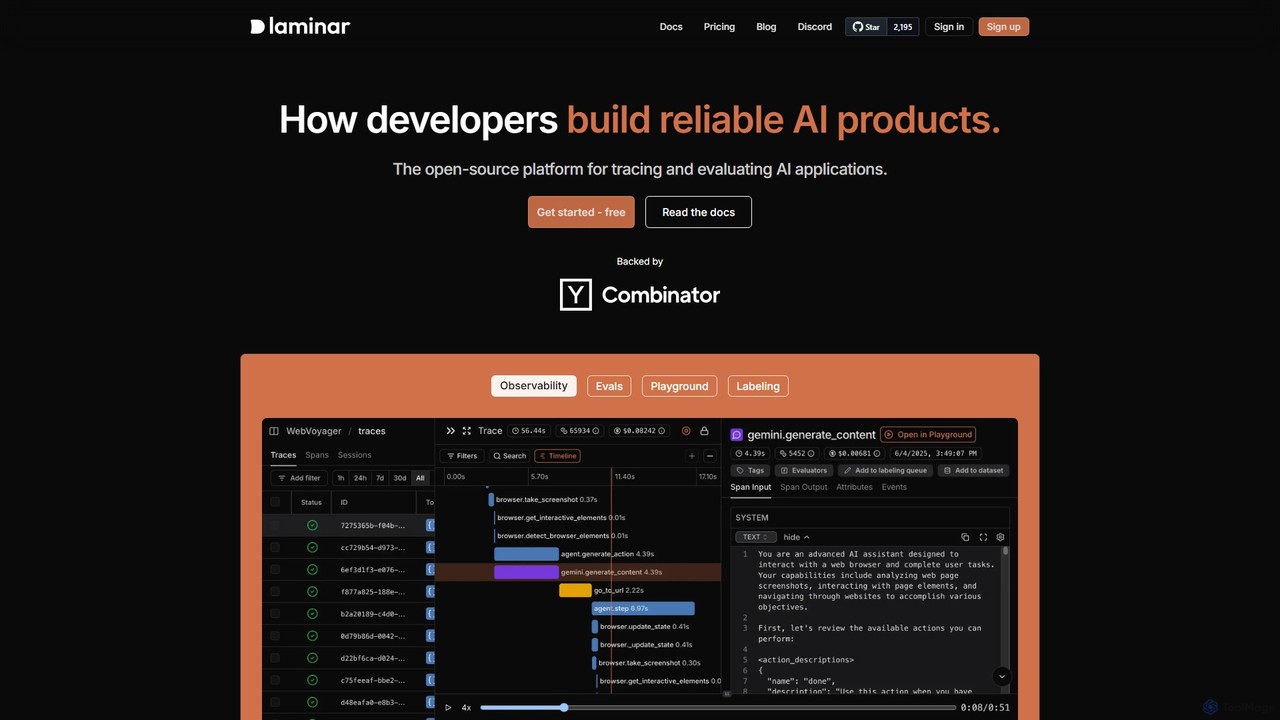
Laminar is an open-source observability and evaluation platform designed for developers building reliable AI applications. It provides comprehensive tools for tracing, evaluating, and debugging LLM-powered systems. Key features include real-time tracing, browser agent observability, an interactive playground, and integrated dataset management, simplifying the entire MLOps lifecycle from development to production.

Debugging
Visits 3.4KFavorites 113Likes 110
Fullview
Freemium

Fullview

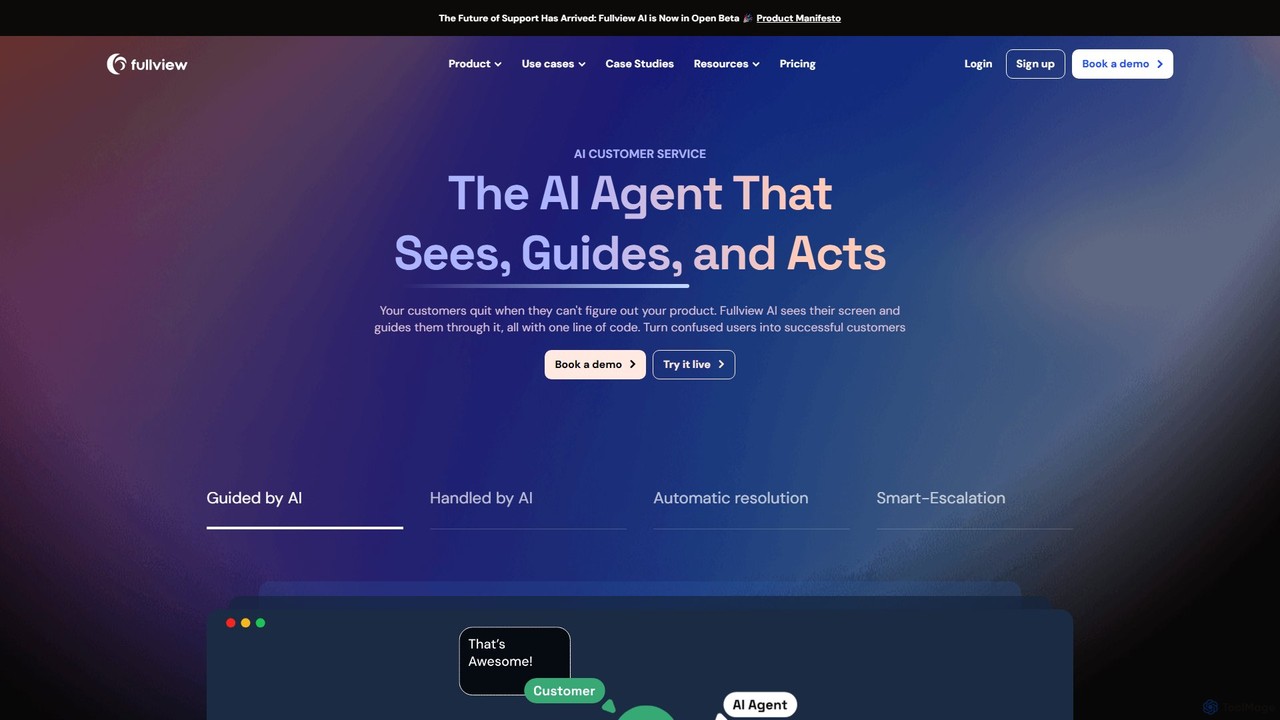
Fullview is an advanced AI customer service agent that goes beyond traditional chatbots. It visually analyzes your product's UI to see what your users see, providing on-screen guidance, step-by-step walkthroughs, and even performing actions autonomously to resolve issues. It's designed to automate support, streamline user onboarding, and enhance overall customer experience with just one line of code.

Chatbots
Visits 15.7KFavorites 111Likes 105
devlo
Freemium

devlo

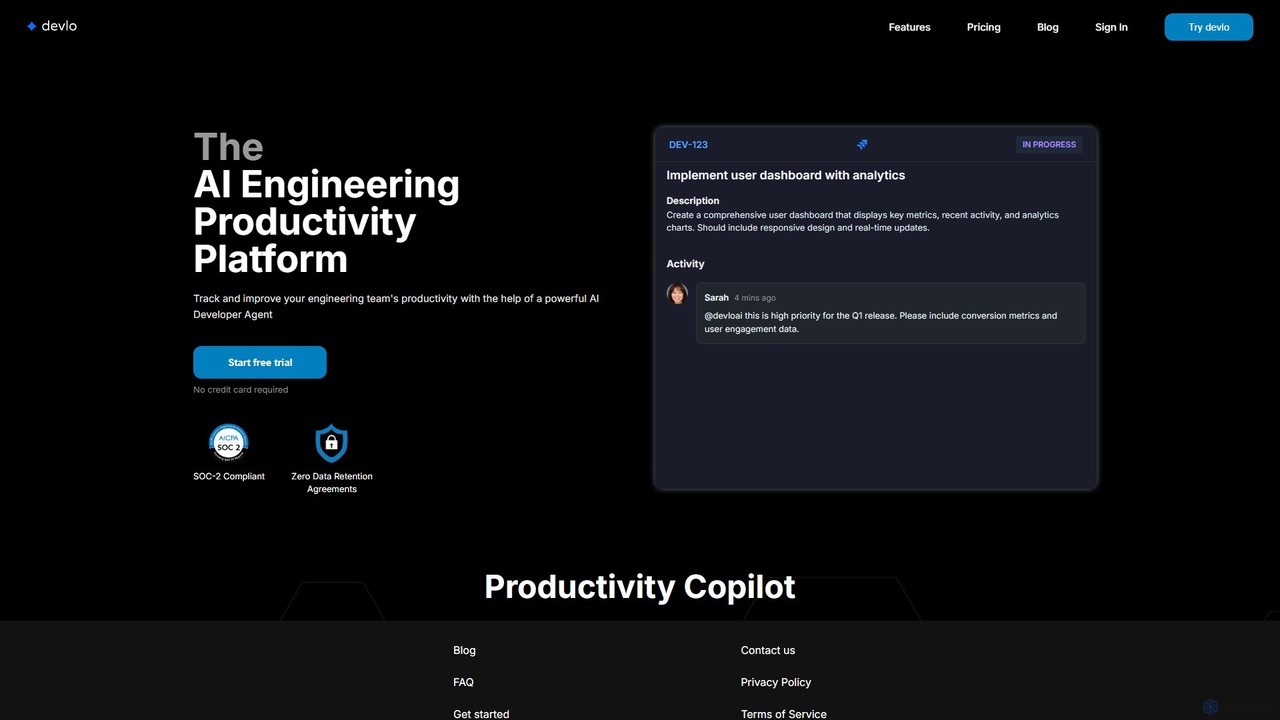
devlo is an AI Engineering Productivity Platform designed to supercharge software development teams. It features an advanced AI Developer Agent that automates coding tasks, performs intelligent code reviews, and provides deep, actionable insights into team performance, helping to accelerate delivery and improve code quality.

Code Assistant
Visits 3.8KFavorites 98Likes 93

About Debugging

AI Debugging tools are a specialized class of developer tools that use artificial intelligence to automate and enhance the process of finding, analyzing, and fixing errors in code. These tools leverage machine learning models trained on vast codebases to understand error patterns, suggest intelligent fixes, and even predict potential bugs before they occur. Their primary value lies in significantly reducing the time and manual effort required for troubleshooting, allowing developers to resolve complex issues more efficiently than with traditional methods. This approach transforms debugging from a reactive task to a proactive, AI-assisted process.

Core Features

  • Intelligent Error Analysis: Automatically interprets stack traces and error messages, providing clear, human-readable explanations of the root cause.
  • Automated Code Suggestions: Generates context-aware code snippets to fix identified bugs, which developers can review and apply directly.
  • Predictive Bug Detection: Proactively scans code to identify logical flaws, potential race conditions, and performance bottlenecks before runtime.
  • Natural Language Querying: Allows developers to ask questions about code behavior or errors in plain English, receiving detailed explanations.

Use Cases

AI Debugging tools are invaluable for software developers, QA engineers, and SREs working on large-scale applications, complex microservices, or legacy systems. They are particularly effective in diagnosing intermittent bugs in production environments and helping new developers quickly understand unfamiliar codebases by explaining logic and data flow.

How to Choose

When selecting an AI Debugging tool, consider its language and framework support to ensure compatibility with your tech stack. Evaluate its integration capabilities with your existing IDE (e.g., VS Code, JetBrains) and CI/CD pipeline. Assess the depth of its analysis—whether it's limited to static analysis or includes runtime insights. Finally, review the tool's data privacy and security policies, especially if it processes proprietary source code.

Featured tool rankings

Debugging use cases

1

Diagnosing Complex Production Errors

A backend developer is alerted to a critical, intermittent error in a production environment. The error logs are cryptic and difficult to reproduce. Instead of spending hours manually inserting log statements and redeploying, the developer feeds the stack trace into an AI debugging tool. The tool analyzes the error against the codebase, identifies the likely race condition causing the issue, and provides a detailed explanation of the interaction between two microservices. It also suggests a code modification using a proper locking mechanism, reducing diagnostic time from days to minutes.

2

Accelerating Onboarding with Legacy Code

A junior developer joins a team and is tasked with fixing a bug in a large, poorly documented legacy system. They struggle to understand the complex logic and data flow. Using an AI debugging assistant, they can highlight a function and ask in natural language, 'What is the purpose of this function and what are its side effects?'. The AI provides a concise summary, explains the variable transformations, and visualizes the call stack. This allows the new developer to become productive much faster and reduces the mentoring burden on senior engineers.

3

Proactive Performance Bottleneck Detection

During a code review process, a developer runs their new feature branch through a predictive AI debugging tool. The tool analyzes the code and flags a section that, while logically correct, contains an inefficient database query within a loop. It predicts that this will cause a significant performance bottleneck under heavy load. The tool also suggests an optimized approach by fetching the data in a single batch query before the loop begins. This proactive identification prevents a performance issue from ever reaching the production environment, saving future remediation costs.

4

Automated Generation of Bug-Fixing Tests

A QA engineer validates a bug fix submitted by a developer. To ensure the fix is robust and doesn't introduce regressions, they use an AI tool. They provide the tool with the original buggy code and the developer's patched code. The AI analyzes the changes and automatically generates a suite of unit and integration tests specifically designed to verify the fix and cover edge cases related to the change. This automates a crucial part of the quality assurance process, increases test coverage, and builds confidence in the stability of the release.

5

Refactoring Code for Readability and Maintenance

A senior developer is tasked with improving a critical but convoluted module. Instead of manually refactoring, they use an AI debugging and code analysis tool. The tool scans the module and identifies 'code smells' such as overly long functions, high cyclomatic complexity, and duplicated logic. It then suggests specific refactoring actions, like extracting methods or simplifying conditional statements, and even generates the refactored code for review. This AI-assisted approach ensures consistency, adheres to best practices, and significantly speeds up the process of improving code quality.

6

Debugging Asynchronous Code Issues

A frontend developer is debugging a race condition in a complex web application that heavily uses asynchronous JavaScript (promises and async/await). Using a traditional debugger is challenging due to the non-linear execution flow. They use an AI debugging tool that can visualize the event loop and the promise chain. The tool clearly illustrates how two separate asynchronous operations are conflicting. It explains the timing issue in simple terms and suggests restructuring the code with `Promise.all` to ensure the operations complete in the correct, predictable order, resolving the bug efficiently.

Debugging FAQ

What are AI Debugging tools?

AI Debugging tools are advanced software utilities that use artificial intelligence, particularly machine learning and natural language processing, to assist developers in identifying, understanding, and fixing code errors. Unlike traditional debuggers that require manual step-by-step inspection, AI tools can automatically analyze error logs, predict potential bugs, suggest code fixes, and explain complex code segments in plain language. They act as intelligent assistants, aiming to accelerate the entire debugging workflow and improve overall code quality.

How do AI Debugging tools differ from traditional debuggers?

The primary difference lies in their approach and level of abstraction. A traditional debugger is a manual tool for inspection; it allows you to set breakpoints, step through code line-by-line, and inspect variable states. You are in full control, but the analysis is entirely up to you. An AI Debugging tool works at a higher level. It automates the analysis, interpreting the context of an error to tell you *why* it might be happening and *how* you could fix it. It's the difference between a magnifying glass (traditional debugger) and a lab assistant who can analyze the sample for you (AI tool).

How do I choose the right AI Debugging tool?

Choosing the right tool depends on your specific needs. Consider the following factors:

  • Technology Stack: Ensure the tool explicitly supports your programming languages, frameworks, and platforms.
  • IDE Integration: A tool that integrates seamlessly into your existing IDE (like VS Code or JetBrains) will be much easier to adopt and use in your daily workflow.
  • Analysis Capabilities: Determine if you need static analysis (checking code without running it), dynamic analysis (analyzing code at runtime), or both. Some tools excel at finding security vulnerabilities, while others focus on performance.
  • Security and Privacy: Be aware of how the tool handles your source code. Does it process code locally on your machine, or is it sent to a cloud service? Choose a tool that aligns with your company's security policies.
Can AI Debugging tools replace human developers?

No, AI Debugging tools are not a replacement for human developers. They are powerful assistants designed to augment a developer's abilities, not supplant them. These tools excel at automating repetitive, time-consuming tasks like analyzing logs or identifying common error patterns. However, they lack the deep contextual understanding of business requirements, architectural design, and creative problem-solving that human developers provide. The final decision-making, critical thinking, and validation of fixes remain firmly in the hands of the developer.

Who benefits most from using AI Debugging tools?

While all developers can benefit, certain groups find these tools particularly valuable. Junior developers can accelerate their learning by getting clear explanations for complex code and errors. Senior developers and architects can quickly diagnose systemic, hard-to-find bugs in large codebases. DevOps and SRE teams can use them to automate the analysis of production errors, leading to faster incident response times. Essentially, anyone working on complex, large-scale, or legacy software projects will see significant productivity gains.