ToolMage
Sign in

Best 35 Visualization AI tools for Data

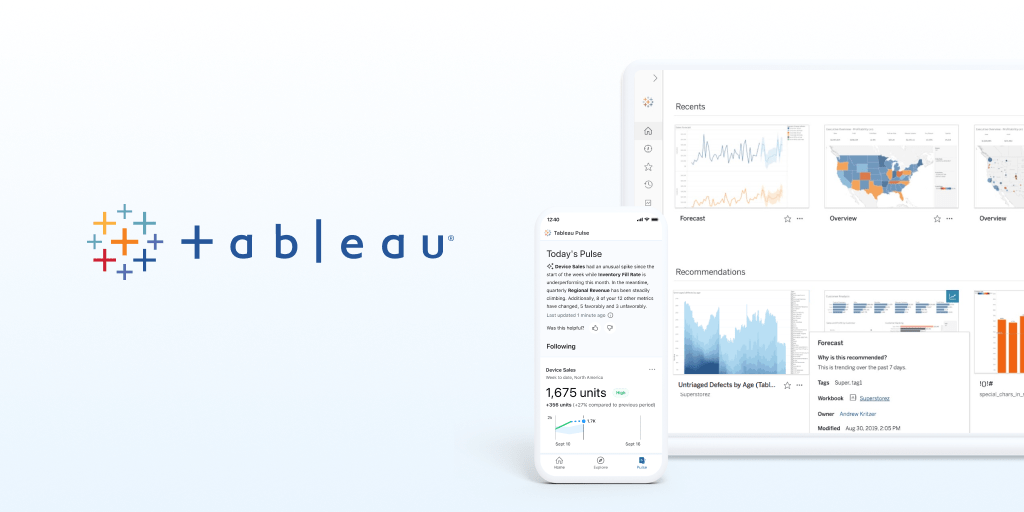
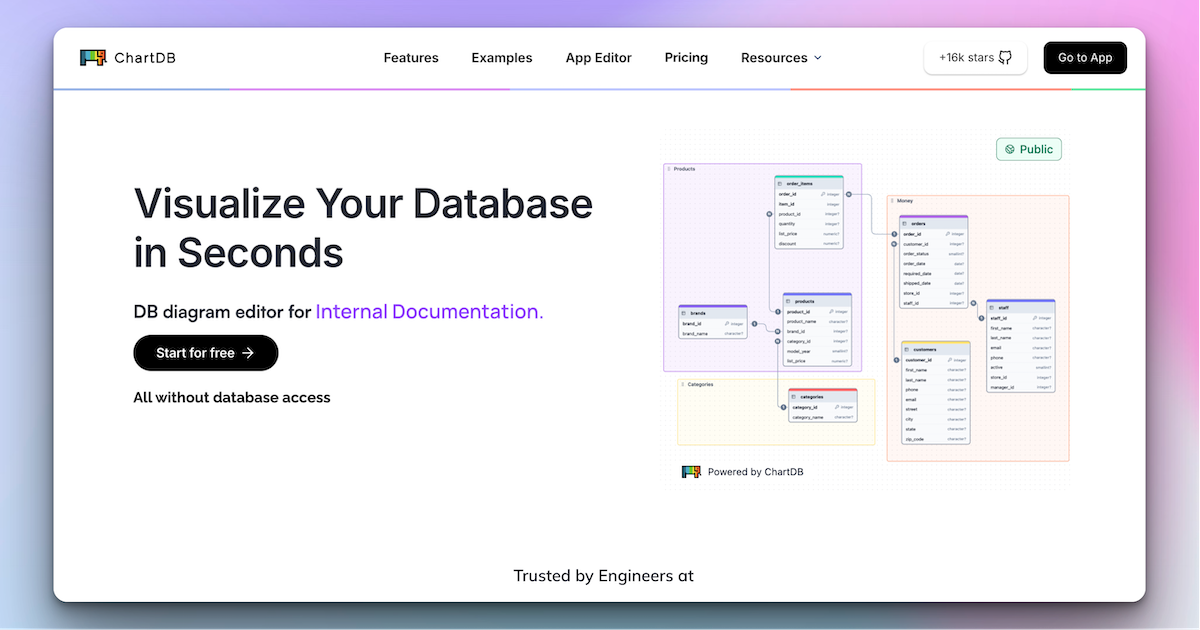
Popular Visualization AI tools in Data include Tableau, Weights & Biases, ChartDB, Local Falcon, Open Knowledge Maps, Mokkup, ChartAI, GraphMaker, Azimutt, and nocodemapapp, helping you work more efficiently.

Vizzy
Freemium

Vizzy

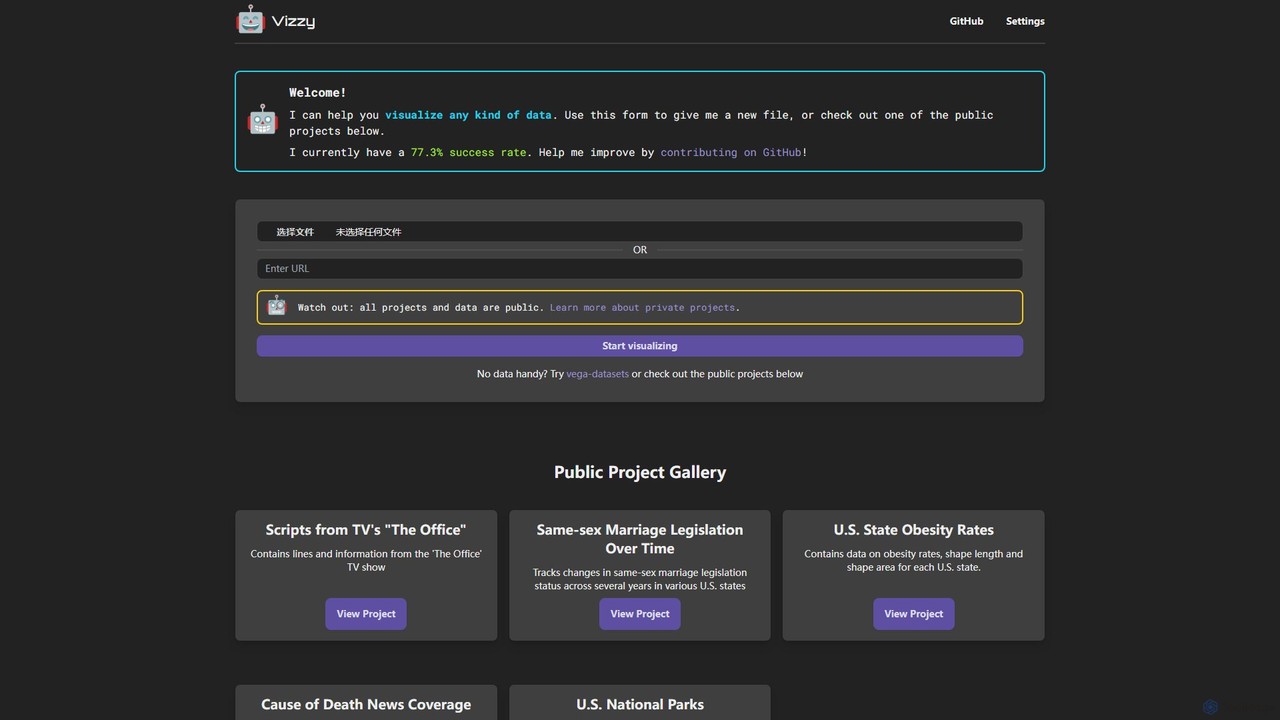
Vizzy is an AI-powered tool that leverages Large Language Models (LLMs) for rapid data visualization. Simply upload your data file, and Vizzy's AI will analyze it to automatically generate insightful charts, graphs, and maps. It's a no-code, open-source platform designed to make data analysis accessible to everyone, from researchers to business analysts. Explore public datasets or visualize your own, turning raw numbers into clear visuals in seconds.

Visualization
Visits 6.3KFavorites 167Likes 166
Eloquence
Freemium

Eloquence

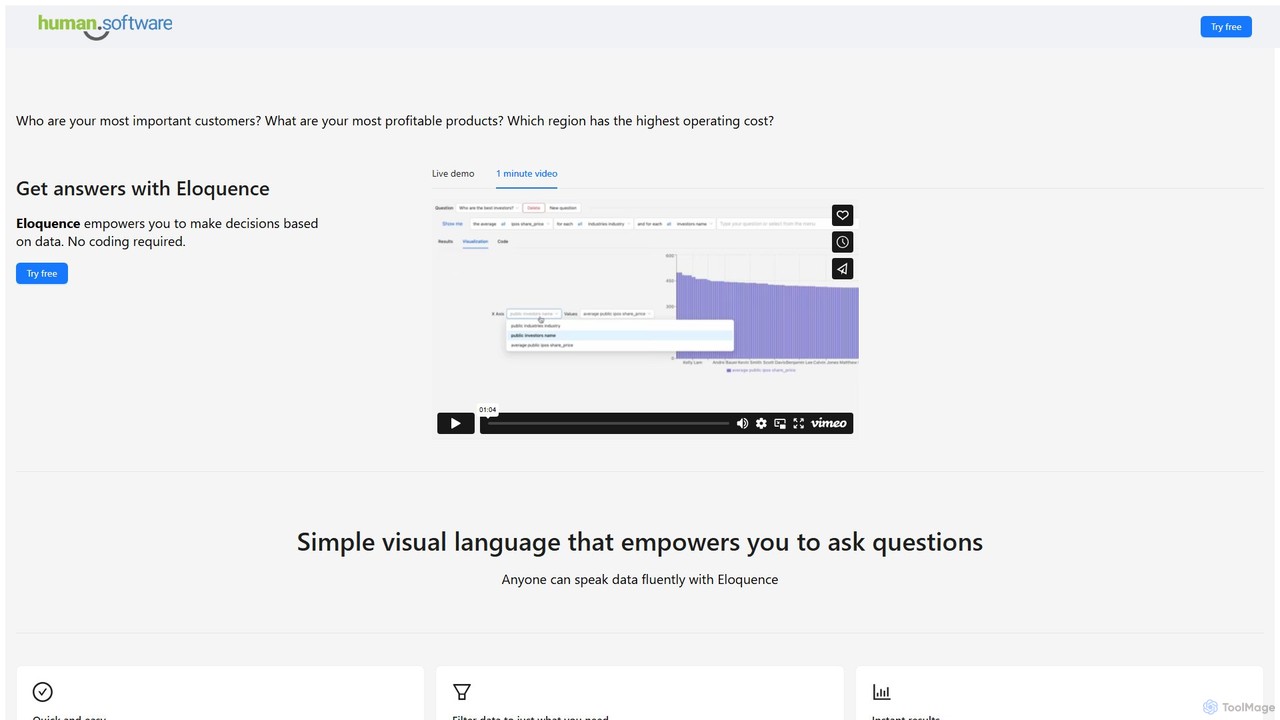
Eloquence is a no-code business intelligence platform that empowers anyone to query databases using structured natural language. Connect your data, ask complex questions without writing code, and get instant answers to make data-driven decisions. It prioritizes security with robust encryption and a strict no-data-saved policy.

Business Intelligence
Visits 7.1KFavorites 125Likes 122
Open Knowledge Maps
Freemium

Open Knowledge Maps

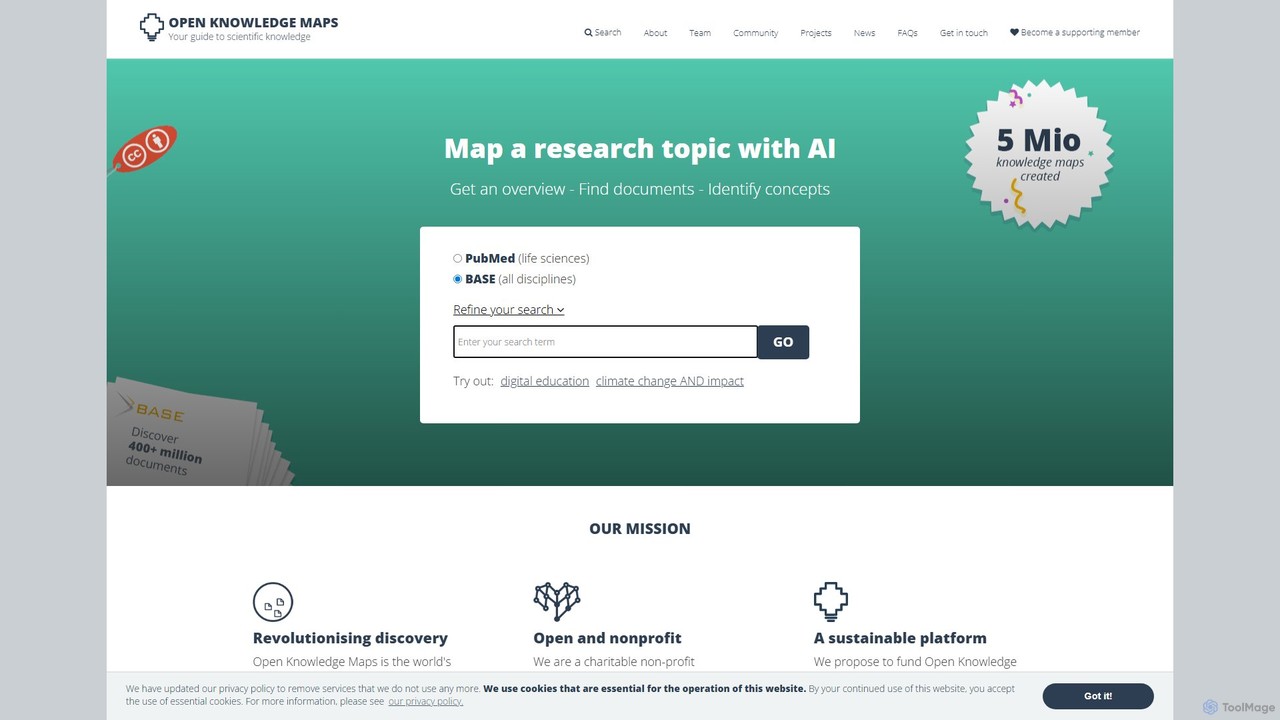
Open Knowledge Maps is a non-profit AI-powered discovery platform that transforms research discovery. It creates visual knowledge maps from millions of research articles, providing an instant overview of a topic. Instead of linear search results, it clusters documents by topic, helping users quickly identify relevant concepts and papers, especially in interdisciplinary fields. It emphasizes open access content and offers services for individuals, libraries, and institutions to enhance research visibility and assessment.

Visualization
Visits 119KFavorites 128Likes 97
Weights & Biases
Freemium

Weights & Biases

Weights & Biases is the leading MLOps platform for developers to build better models faster. It helps machine learning teams track experiments, version datasets, manage model lifecycles, and collaborate seamlessly. Ideal for everything from academic research to enterprise-level AI development.

Visualization
Visits 2.5MFavorites 155Likes 143
Azimutt
Freemium

Azimutt

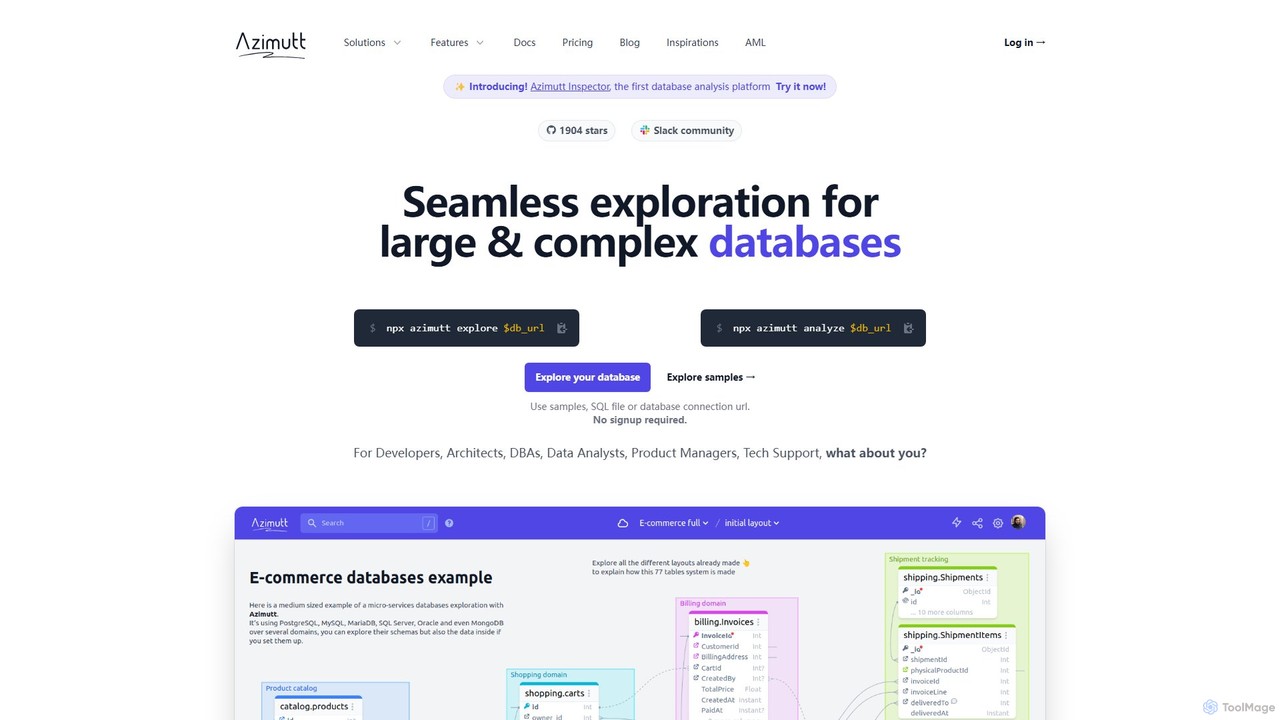
Azimutt is an advanced database explorer and analyzer designed for large, complex databases. It helps developers, DBAs, and data analysts visualize, document, and optimize their database schemas. With features like incremental layout building, AI-powered SQL generation, and collaborative documentation, Azimutt simplifies database exploration, improves team efficiency, and ensures database health.

Visualization
Visits 20.7KFavorites 128Likes 128
nocodemapapp
Freemium

nocodemapapp

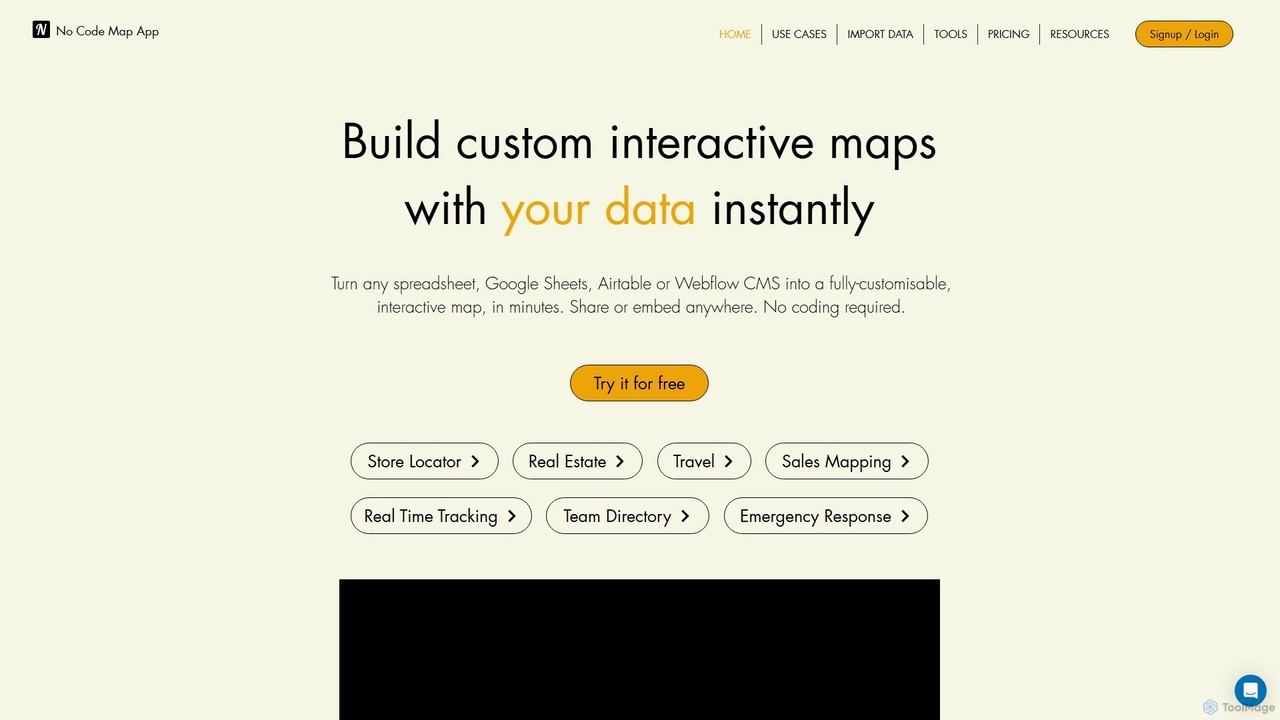
nocodemapapp is an AI-powered, no-code platform that instantly transforms data from spreadsheets, Google Sheets, Airtable, or Webflow CMS into fully customizable, interactive maps. Create store locators, real estate listings, or sales territory maps in minutes. Features include automatic data sync, heatmap layers, and deep design customization. Share or embed your responsive map anywhere, no coding required.

Location Intelligence
Visits 18.6KFavorites 162Likes 156
EzInsights
Paid

EzInsights

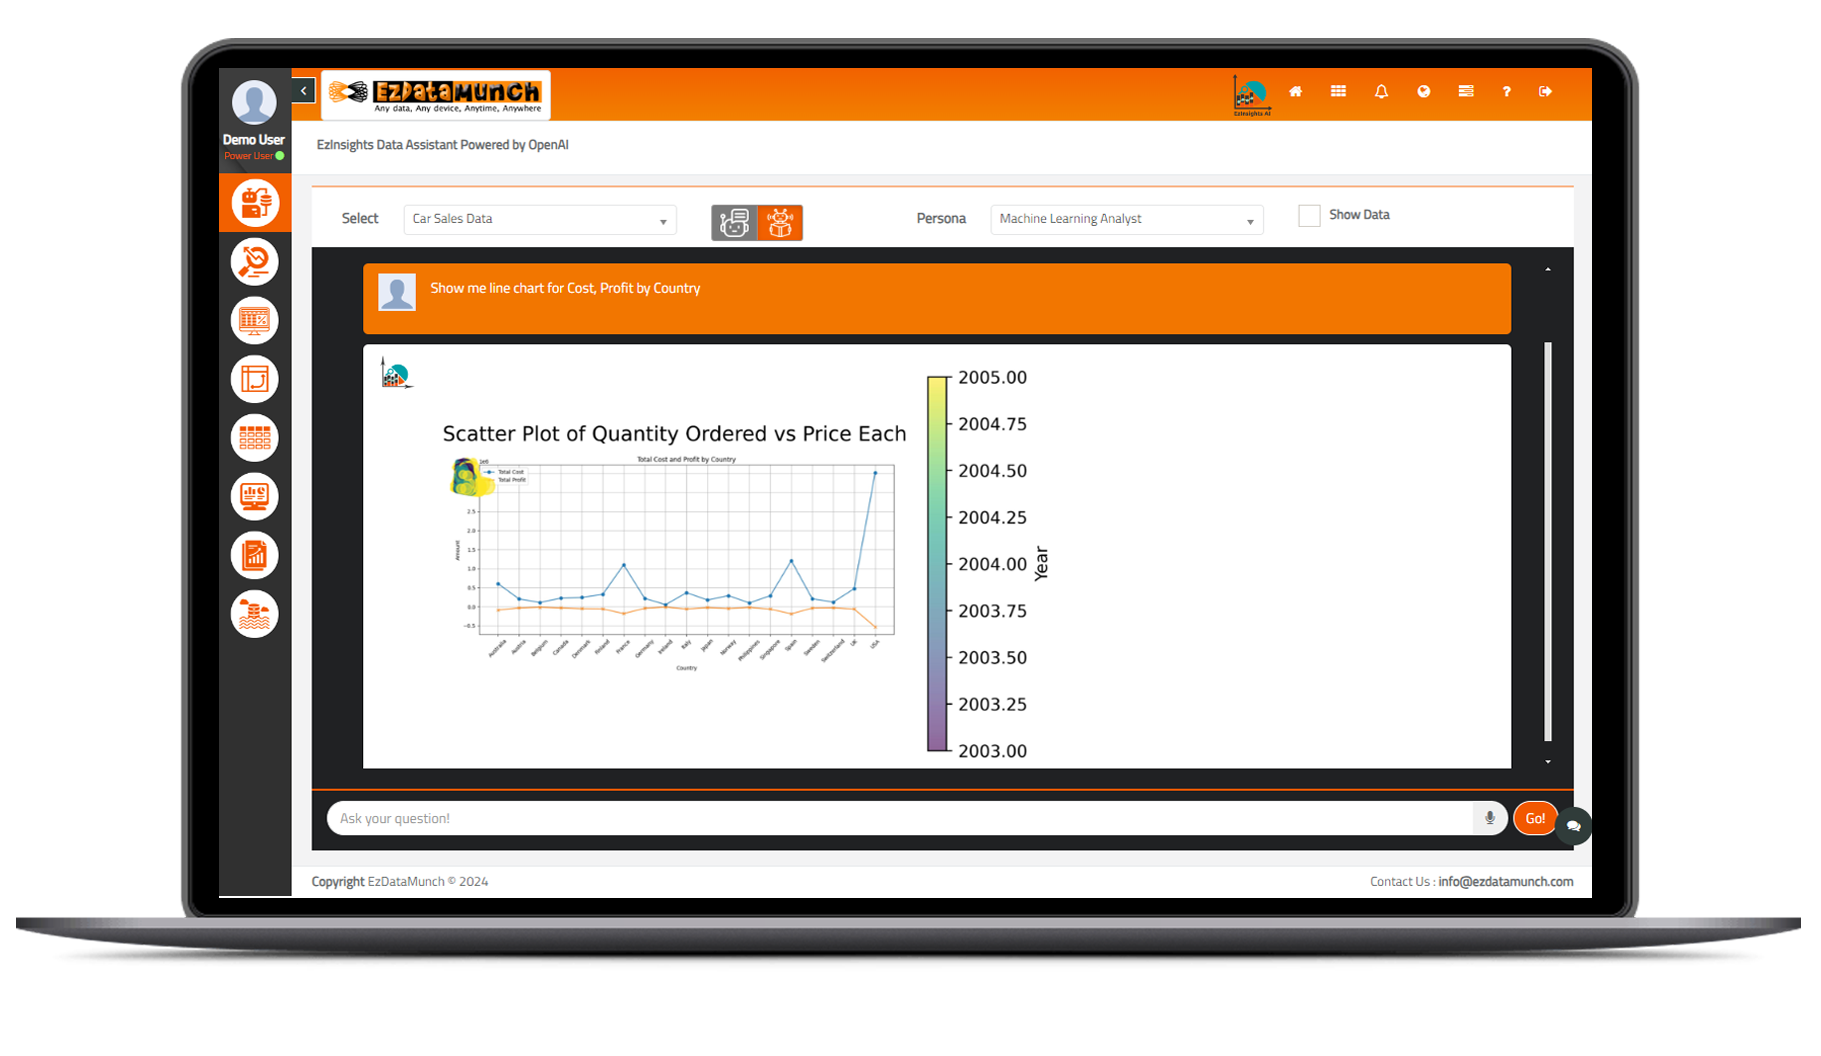
EzInsights is an AI-powered business intelligence platform that enables users to interact with their data using natural language. It combines generative AI with advanced analytics and visualization tools to provide instant, data-driven insights, automated reports, and predictive analytics, empowering teams to make smarter decisions without technical expertise.

Data
Visits 6.2KFavorites 178Likes 163
SheetBot
Freemium

SheetBot

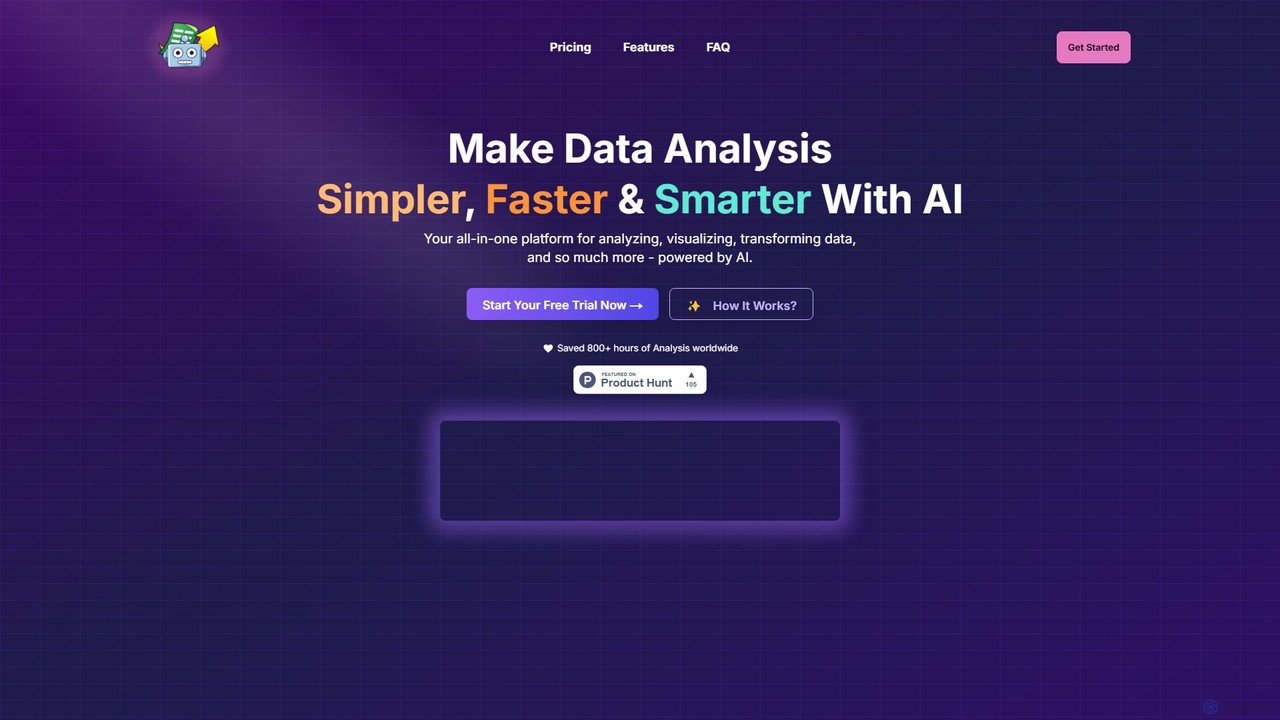
SheetBot is an AI-powered data analysis platform that enables users to analyze, visualize, and transform data without writing any code. Simply upload your dataset or connect a data source, ask questions in plain English, and receive instant insights, trends, and dynamic visualizations. Powered by advanced models like GPT-4o and Claude 3.5 Sonnet, it streamlines complex analyses, turning hours of work into minutes.

Business Intelligence
Visits 6.4KFavorites 152Likes 142
ExcelDashboard.ai
Freemium

ExcelDashboard.ai

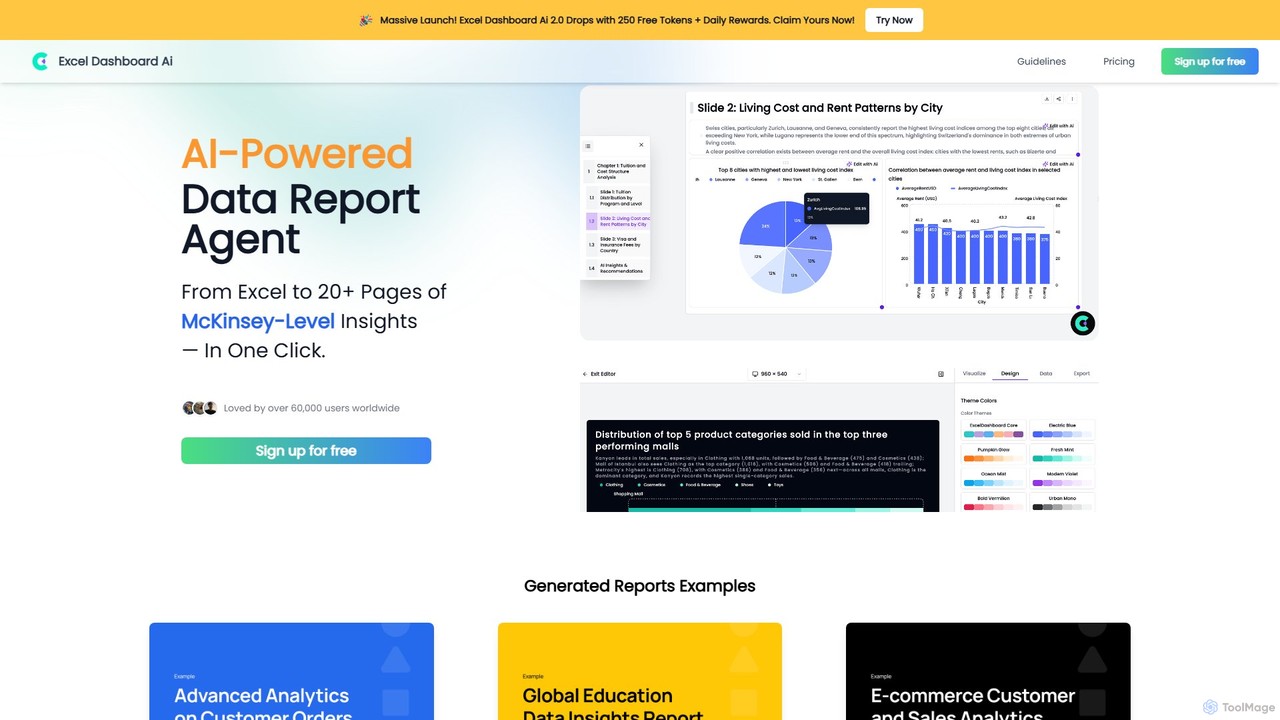
ExcelDashboard.ai is an AI-powered data analysis tool that instantly transforms raw Excel or CSV files into interactive dashboards and comprehensive, multi-page reports. With a single click, it generates deep, McKinsey-level insights, visualizes data, and allows users to explore information using natural language commands. It's designed for users of all skill levels to make data-driven decisions without needing programming expertise.

Business Intelligence
Visits 13.7KFavorites 162Likes 150
aiflowchart
Freemium

aiflowchart

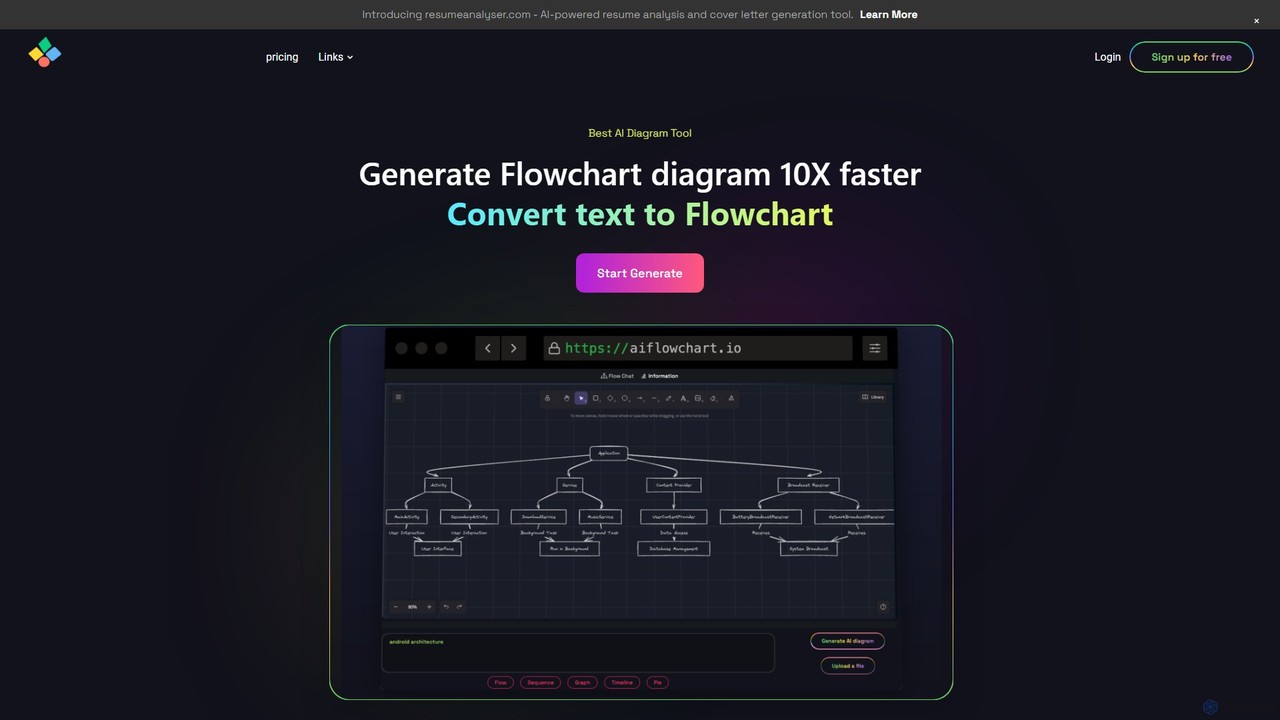
An AI-powered diagramming tool that automatically generates flowcharts, sequence diagrams, pie charts, and more from text, PDFs, or blog content. It leverages models like GPT-4o to create unique, customizable diagrams with explanations, saving users significant time and effort.

Visualization
Visits 7.7KFavorites 113Likes 104
Docugram
Freemium

Docugram

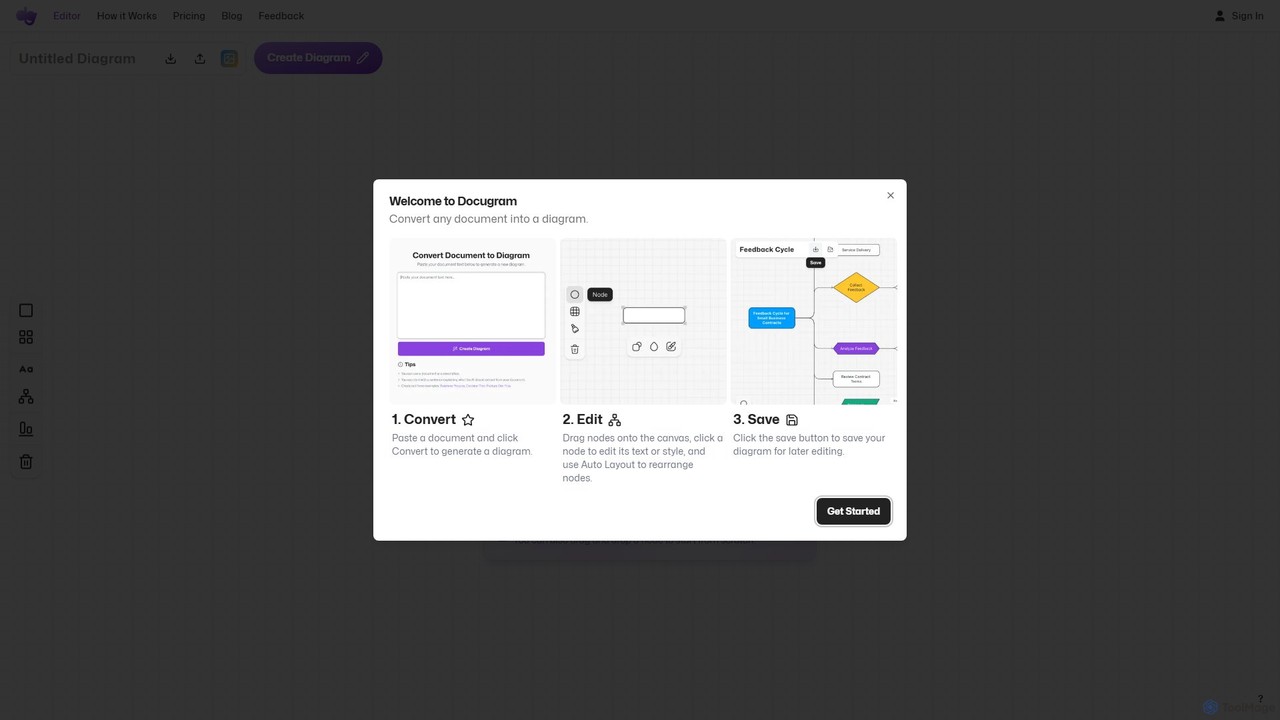
Docugram is an AI-powered tool that instantly transforms text documents, notes, and prompts into clear, editable diagrams and flowcharts. It streamlines workflows by converting complex information from formats like Word, Excel, and PDF into visual maps, enhancing productivity for professionals in project management, development, and business analysis.

Project Management
Visits 9.3KFavorites 134Likes 130

About Visualization

AI Visualization tools are a sophisticated category of AI-powered solutions specifically designed to transform complex, raw data into intuitive, interactive, and actionable visual representations. These advanced tools leverage cutting-edge artificial intelligence algorithms, including machine learning, deep learning, and natural language processing, to automate the entire data interpretation process. They intelligently suggest optimal chart types based on data characteristics, identify hidden patterns and anomalies, and even generate dynamic, customizable dashboards. The primary value of AI Visualization lies in its ability to empower users to quickly identify critical insights, understand underlying trends, and make more informed, data-driven decisions from vast and disparate datasets, significantly enhancing the efficiency and depth of data analysis.

Core Features

  • Intelligent Chart Recommendation: AI algorithms analyze the structure and nature of your data to automatically suggest the most appropriate and effective visualization types, from bar charts to complex network graphs.
  • Automated Data Insights: Beyond mere display, these tools proactively identify key trends, outliers, correlations, and anomalies within datasets, often providing natural language explanations for these discoveries.
  • Natural Language Report Generation: Many advanced AI visualization platforms can translate complex visual findings into clear, concise, and easy-to-understand textual summaries and comprehensive reports.
  • Interactive Dashboard Building: Users can rapidly create dynamic, customizable dashboards with drill-down capabilities, filters, and real-time updates, allowing for deep exploration of data.
  • Real-time Data Integration: Seamlessly connects with a wide array of data sources, including databases, cloud platforms, APIs, and various file formats, ensuring visualizations are always based on the most current information.

Applicable Scenarios

AI Visualization tools are becoming indispensable across a multitude of professional domains. Business intelligence analysts utilize them to gain deep insights into market trends, sales performance, and customer behavior, transforming raw numbers into strategic advantages. Researchers in scientific and academic fields leverage these tools to explore and present complex experimental data, simulations, and statistical models in an intuitive manner. Marketing and communications professionals employ AI visualization to craft compelling data stories, illustrating campaign effectiveness, audience engagement, and brand sentiment. Furthermore, financial analysts use them to identify risk patterns and investment opportunities, while healthcare providers visualize patient data for improved diagnostics and treatment planning.

How to Choose

Selecting the ideal AI Visualization tool requires a careful evaluation of several critical factors to ensure it aligns with your specific needs. Firstly, assess its compatibility with your existing data infrastructure, including support for various databases, cloud services, and file formats. Secondly, examine the breadth and depth of visualization types offered, along with the flexibility for customization to meet unique reporting requirements. Thirdly, evaluate the sophistication of its AI capabilities, such as the accuracy of automated insights, chart recommendations, and natural language generation. User interface intuitiveness, ease of use, and the learning curve are also paramount for widespread adoption. Finally, consider collaboration features, sharing options, security protocols, and the pricing model to ensure it scales with your team and budget.

Featured tool rankings

Visualization use cases

1

Marketing Campaign Performance Analysis

Marketing professionals utilize AI visualization tools to consolidate data from various advertising platforms, website analytics, and CRM systems. The tools automatically generate interactive dashboards, allowing marketers to quickly identify top-performing channels, content, and audience segments. This enables data-driven optimization of campaign strategies, budget allocation, and ROI measurement, saving significant time compared to manual reporting.

2

Sales Performance & Forecasting

Sales managers leverage AI visualization to gain comprehensive insights into historical sales data, customer demographics, and market trends. These tools present complex sales funnels, regional performance, and individual rep productivity through intuitive charts and predictive models. This helps in identifying growth opportunities, forecasting future sales revenue, and making strategic decisions for sales team management and resource allocation.

3

Financial Risk & Fraud Detection

Financial analysts and risk managers employ AI visualization to process vast amounts of transactional data, market fluctuations, and compliance records. The tools automatically highlight anomalies, potential fraud patterns, and emerging risk factors through heatmaps, scatter plots, and network graphs. This provides a clear, real-time overview of financial health and potential vulnerabilities, aiding in proactive risk mitigation and regulatory adherence.

4

Healthcare Patient Data Insights

Healthcare administrators and medical researchers use AI visualization to analyze patient records, treatment outcomes, drug efficacy, and epidemiological data. The tools transform complex clinical data into accessible dashboards, revealing patterns in disease progression, treatment effectiveness, and population health trends. This supports evidence-based clinical decision-making, resource allocation, and the identification of areas for public health intervention.

5

Supply Chain Optimization

Supply chain managers utilize AI visualization to monitor and optimize complex logistics, inventory levels, and supplier performance. By integrating data from various points in the supply chain, these tools provide dynamic dashboards that pinpoint bottlenecks, predict demand fluctuations, and visualize delivery routes. This leads to improved inventory management, reduced operational costs, and enhanced overall supply chain resilience and efficiency.

6

Social Media Sentiment Analysis

Brand managers and PR teams deploy AI visualization tools to analyze large volumes of social media data, including comments, mentions, and engagement metrics. The tools generate sentiment trend graphs, keyword clouds, and demographic breakdowns, offering immediate insights into public perception and brand reputation. This enables rapid response to crises, identification of influencer opportunities, and refinement of communication strategies.

Visualization FAQ

What are AI Visualization tools?

AI Visualization tools are advanced software solutions that use artificial intelligence to transform raw, complex data into intuitive and interactive visual formats like charts, graphs, and dashboards. Unlike traditional tools, they leverage AI to automate data interpretation, suggest optimal visualization types, and uncover hidden insights, making data analysis faster and more accessible for users across various industries.

How do AI Visualization tools differ from traditional data visualization software?

The key difference lies in AI's intelligent automation. Traditional tools require manual selection of chart types and extensive configuration, often presenting static views. AI Visualization tools, however, use machine learning to automatically recommend the best visuals, identify trends, and even generate natural language summaries. They offer more dynamic, predictive, and insight-driven experiences, significantly reducing the manual effort in data exploration and reporting.

How can I choose the right AI Visualization tool for my needs?

To select the right tool, consider several factors: first, ensure it supports your specific data sources (e.g., databases, cloud platforms, APIs). Second, evaluate the range of visualization types and customization options it offers. Third, assess the sophistication of its AI features, such as automated insights and chart recommendations. Finally, prioritize user-friendliness, integration capabilities with other business tools, and a pricing model that fits your budget and scalability requirements.

What are the main features of AI Visualization tools?

AI Visualization tools typically offer several core features. These include intelligent chart recommendation, where AI suggests the most suitable visual based on your data; automated data insights, which proactively highlight trends, anomalies, and correlations; natural language generation for converting visuals into textual reports; interactive dashboard building for dynamic data exploration; and real-time data integration to keep your visualizations current. Some also offer predictive analytics capabilities.

In which industries are AI Visualization tools most commonly used?

AI Visualization tools are widely adopted across numerous industries due to their ability to simplify complex data. They are extensively used in business intelligence, marketing, and sales for performance tracking and forecasting. In finance, they aid in risk management and fraud detection. Healthcare leverages them for patient data analysis and research. Additionally, they are crucial in scientific research, supply chain management, and media for data storytelling and audience insights.