Doc2Q
Doc2Q is an AI-powered tool that transforms documents (PDF, DOCX, images) into various formats like infographics, quizzes, diagrams, …
Doc2Q is an AI-powered tool that transforms documents (PDF, DOCX, images) into various formats like infographics, quizzes, diagrams, and datasets. It operates on a flexible pay-as-you-go credit system, allowing users to convert content quickly and efficiently for marketing, education, or data analysis purposes.
Mokkup
Mokkup is an AI-powered dashboard wireframing tool that transforms text prompts into high-fidelity, BI-ready mockups in minutes. Designed …
Mokkup is an AI-powered dashboard wireframing tool that transforms text prompts into high-fidelity, BI-ready mockups in minutes. Designed for data analysts and BI developers, it simplifies the design process with a drag-and-drop editor, real-time collaboration, and one-click export to Power BI and Tableau, accelerating the entire business intelligence workflow.

Viewit Ai Chatbot
An AI-powered chatbot that transforms your data into insightful visualizations and summaries through simple, natural language conversations. Upload …
An AI-powered chatbot that transforms your data into insightful visualizations and summaries through simple, natural language conversations. Upload your dataset, ask questions, and instantly receive charts, graphs, and key metrics, making data analysis accessible to everyone without needing complex software or coding skills.
InsightJini
InsightJini is an AI-powered data analysis tool that lets you chat with your Excel and CSV files. Upload …
InsightJini is an AI-powered data analysis tool that lets you chat with your Excel and CSV files. Upload your data to instantly generate visualizations and insights without any coding. Its conversational interface, powered by ChatGPT, makes data exploration intuitive and accessible for everyone.
MyLens
MyLens is an AI-powered visualization tool that transforms your ideas and various content formats—like PDFs, URLs, text, and …
MyLens is an AI-powered visualization tool that transforms your ideas and various content formats—like PDFs, URLs, text, and videos—into clear, interactive, and editable diagrams. With a single click, it helps you understand complex information, brainstorm effectively, and create presentation-ready visuals, acting as your personal visual planner.
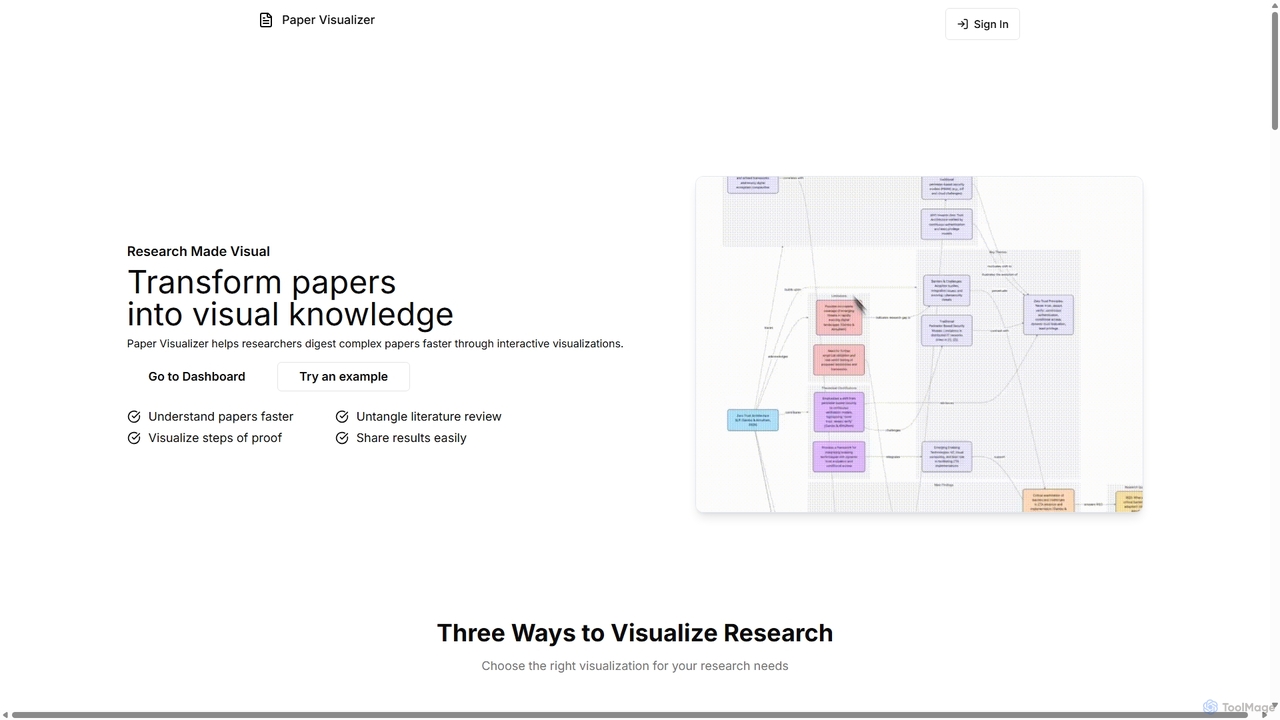
Paper Visualizer
Paper Visualizer is an AI-powered tool that transforms complex research papers into interactive visualizations and knowledge graphs. It …
Paper Visualizer is an AI-powered tool that transforms complex research papers into interactive visualizations and knowledge graphs. It helps researchers, students, and academics quickly digest dense information, understand technical details, and map literature connections, accelerating the research process.
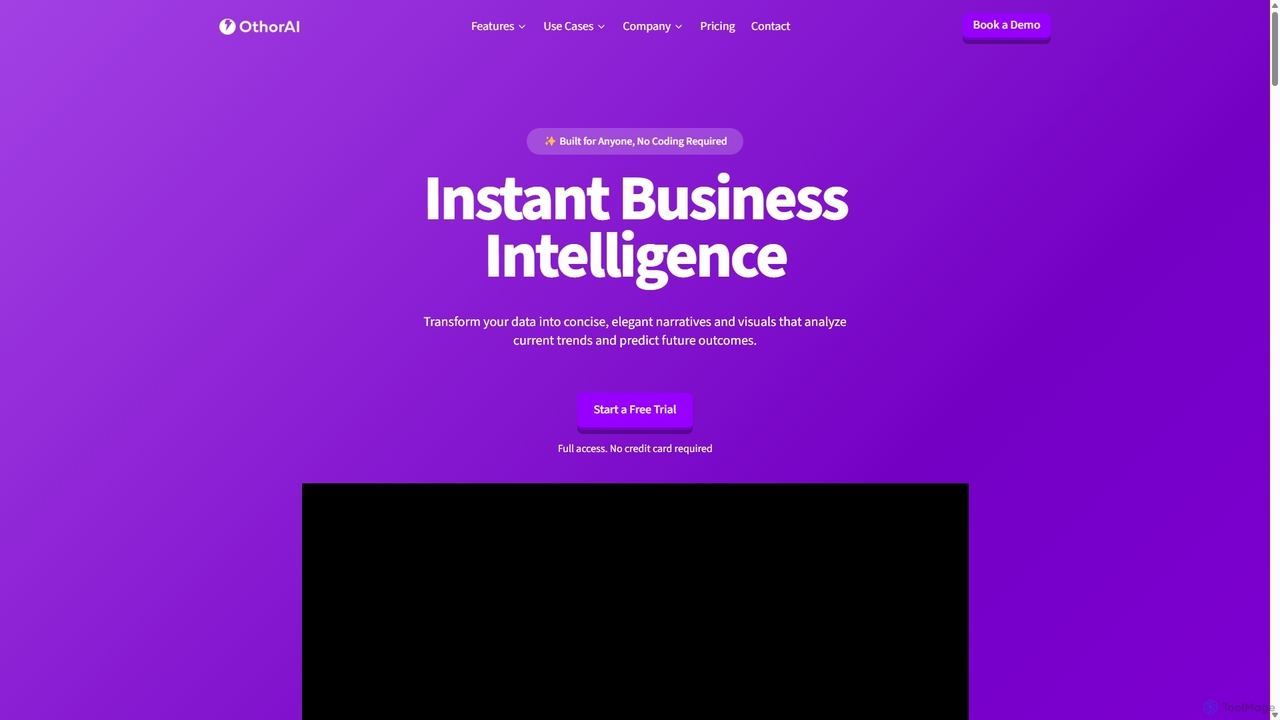
Othor AI
Othor AI is a no-code business intelligence platform that transforms your data into actionable insights in seconds. It …
Othor AI is a no-code business intelligence platform that transforms your data into actionable insights in seconds. It automatically generates narrative-driven reports, smart charts, and predictive analytics, enabling anyone in your organization to make faster, data-driven decisions without technical expertise. Connect your data sources and get instant dashboards and executive summaries.

Local Falcon
Local Falcon is an advanced AI-powered local rank tracking tool that visualizes your business's SEO performance on a …
Local Falcon is an advanced AI-powered local rank tracking tool that visualizes your business's SEO performance on a geo-grid map. It provides hyper-local ranking data, AI-driven analysis, and actionable recommendations to improve your visibility in Google's Map Pack and local search results.
alltum.io
alltum.io is an AI-powered business intelligence platform that unifies data from various sources, providing actionable insights through interactive …
alltum.io is an AI-powered business intelligence platform that unifies data from various sources, providing actionable insights through interactive dashboards, predictive analytics, and automated reporting. It empowers businesses of all sizes to make smarter, data-driven decisions effortlessly.
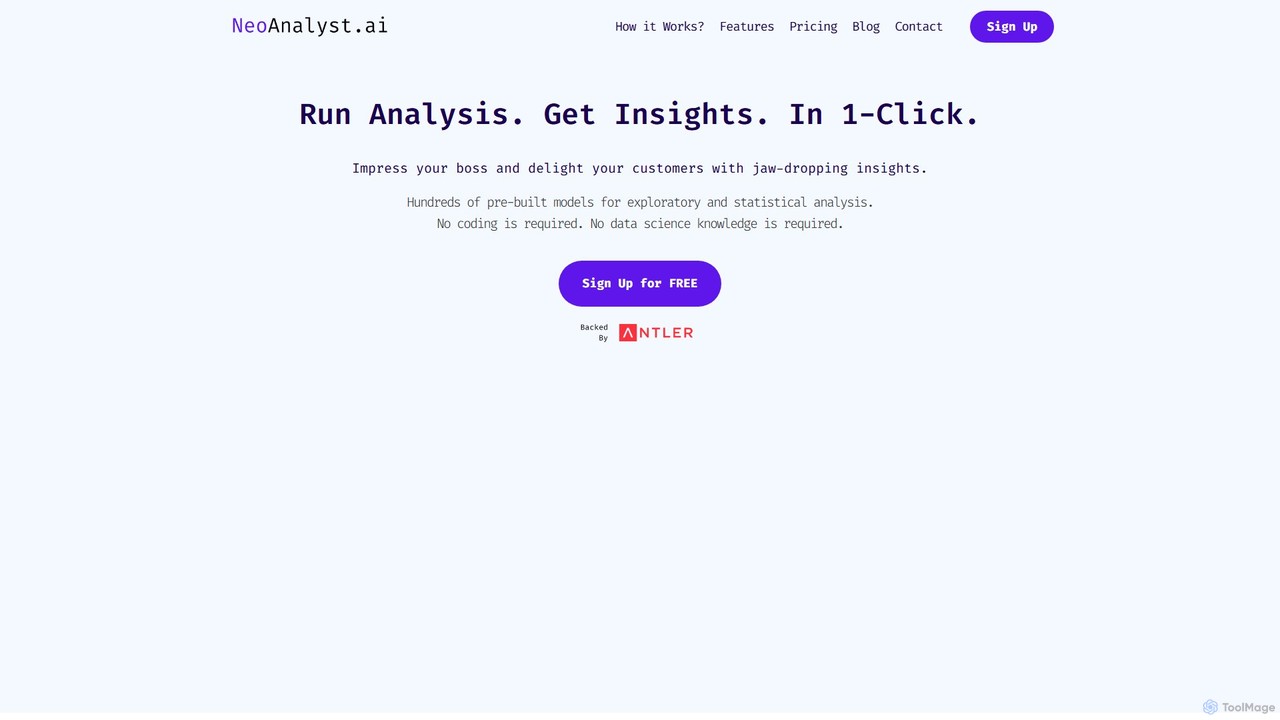
NeoAnalyst
NeoAnalyst is a no-code AI data analysis platform designed for business leaders and analysts. It transforms raw data …
NeoAnalyst is a no-code AI data analysis platform designed for business leaders and analysts. It transforms raw data into actionable insights, visualizations, and statistical recommendations with a single click, eliminating the need for coding or data science expertise. It supports any dataset and provides pre-built models for instant analysis.
GraphMaker
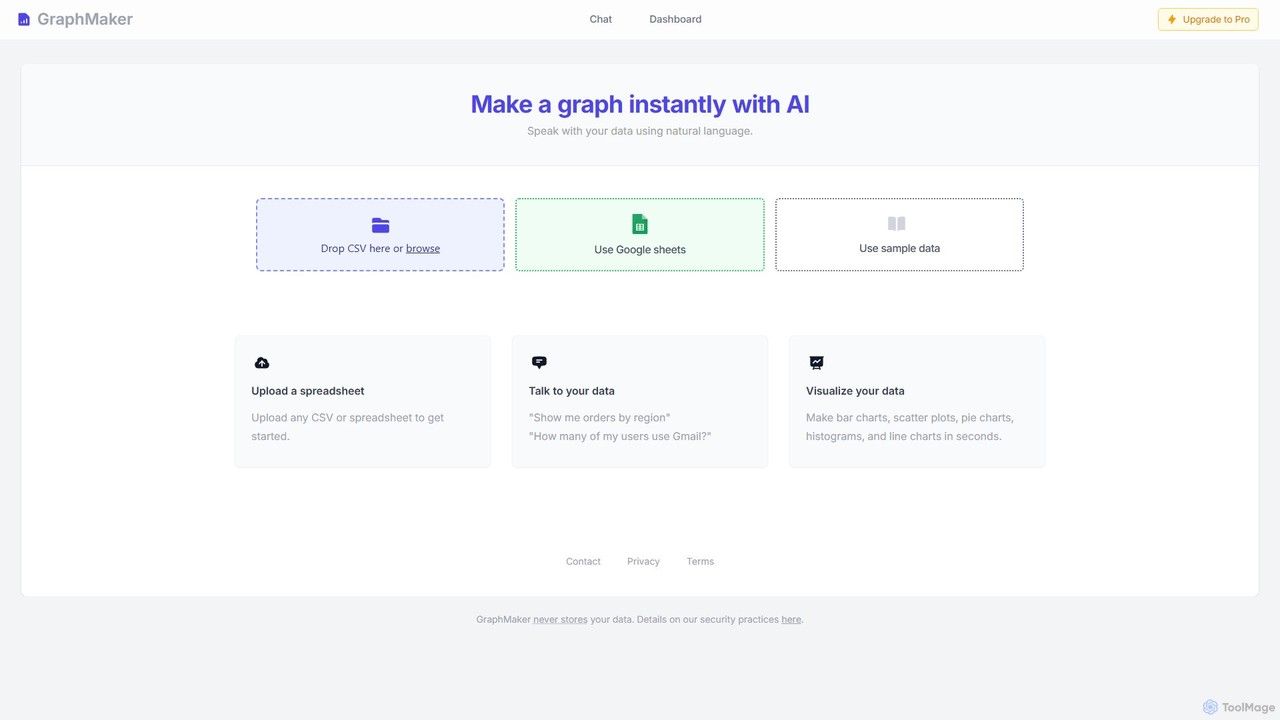
GraphMaker is an AI-powered data visualization tool that allows you to create various charts and graphs in seconds. …
GraphMaker is an AI-powered data visualization tool that allows you to create various charts and graphs in seconds. Simply upload your data from a CSV file or Google Sheets, and use natural language commands to generate insightful visualizations like bar charts, pie charts, and histograms. It's designed for speed, simplicity, and security, as it never stores your data.
Varos
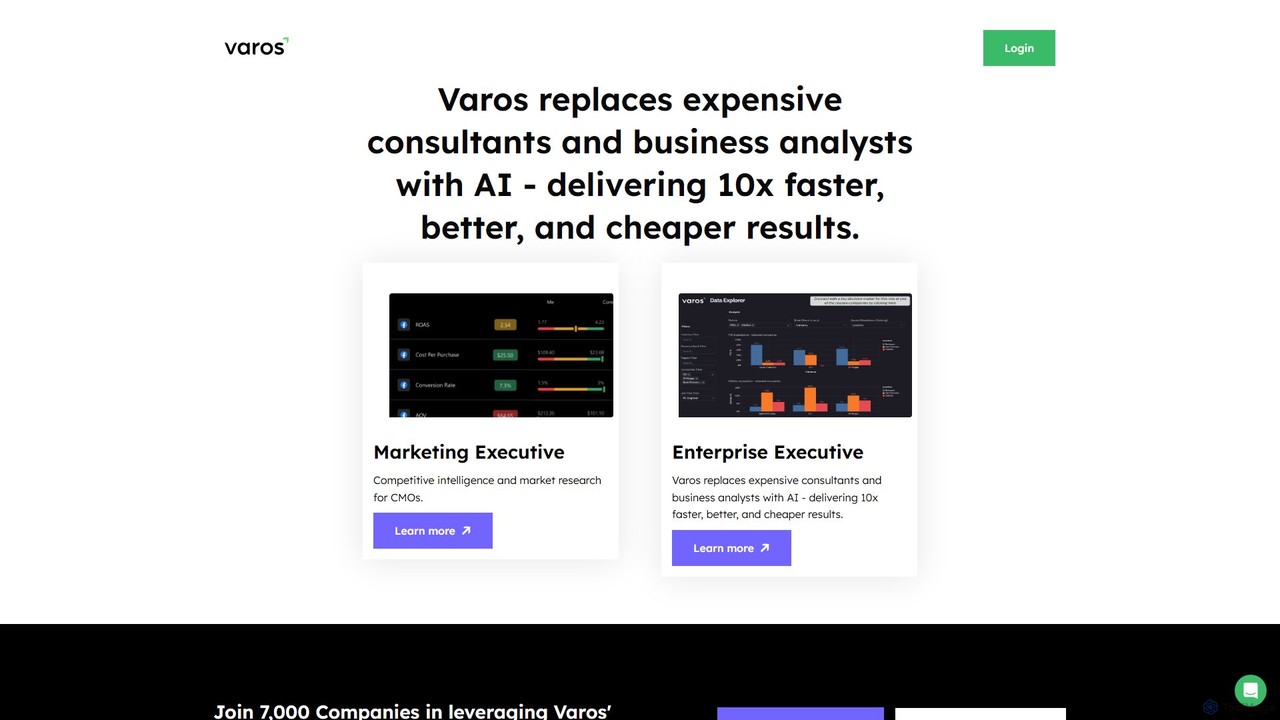
Varos is an AI-powered competitive intelligence platform that provides real-time, anonymized benchmarks for e-commerce marketing. It enables businesses …
Varos is an AI-powered competitive intelligence platform that provides real-time, anonymized benchmarks for e-commerce marketing. It enables businesses to compare their performance metrics across Shopify, Meta, Google, and TikTok Ads against industry peers, replacing expensive consultants with data-driven insights.
chat2csv
chat2csv is an AI-powered data visualization tool that transforms CSV files into various charts using simple, natural language …
chat2csv is an AI-powered data visualization tool that transforms CSV files into various charts using simple, natural language commands. No coding is required. Just upload your data, chat with the AI, and instantly generate bar charts, pie charts, line graphs, and more. It's designed for quick, intuitive analysis while prioritizing user data privacy.
ChartFast
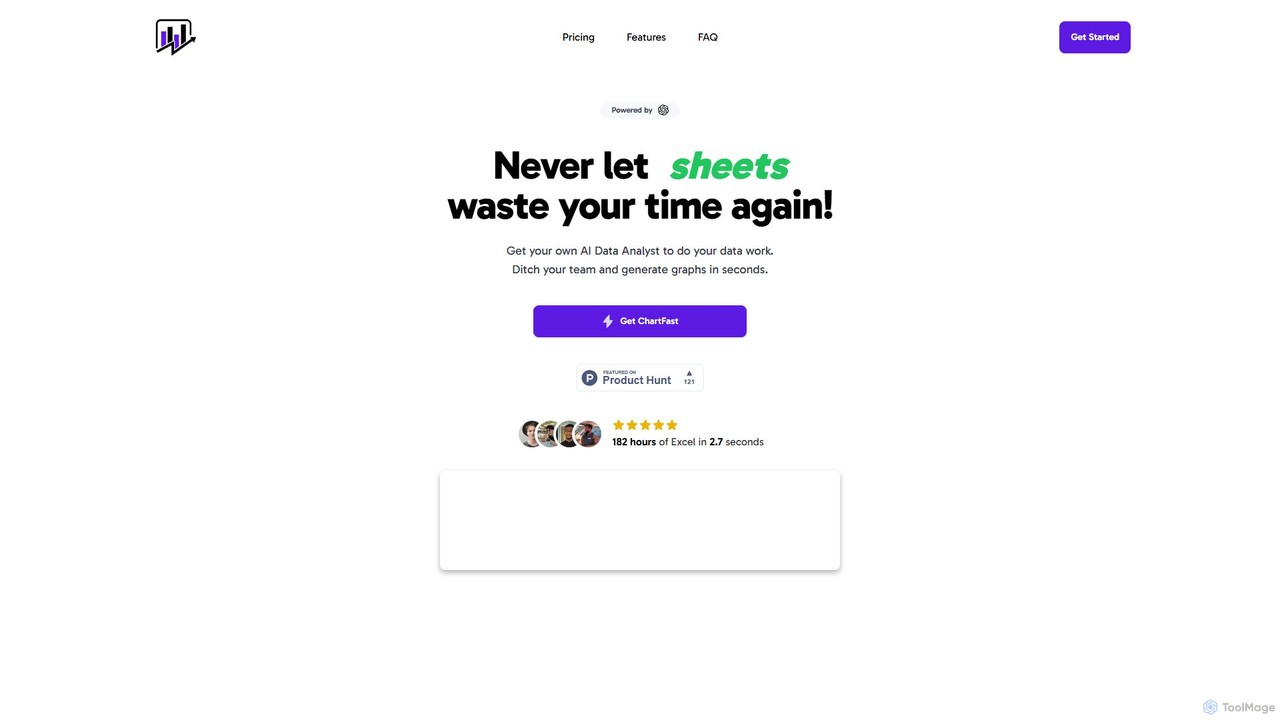
ChartFast is an AI-powered data analyst that transforms your data work. Upload CSV or Excel files, and it …
ChartFast is an AI-powered data analyst that transforms your data work. Upload CSV or Excel files, and it automatically cleans, analyzes, and visualizes your data. Generate complex charts and gain insights in seconds by simply asking questions, eliminating hours of manual spreadsheet tasks.
workviz.io
workviz.io is an AI-powered workforce analytics and project visualization platform. It transforms complex work data into clear, interactive …
workviz.io is an AI-powered workforce analytics and project visualization platform. It transforms complex work data into clear, interactive dashboards, helping teams optimize workflows, monitor project progress, and enhance productivity through intelligent insights and predictive analytics.
ChartDB
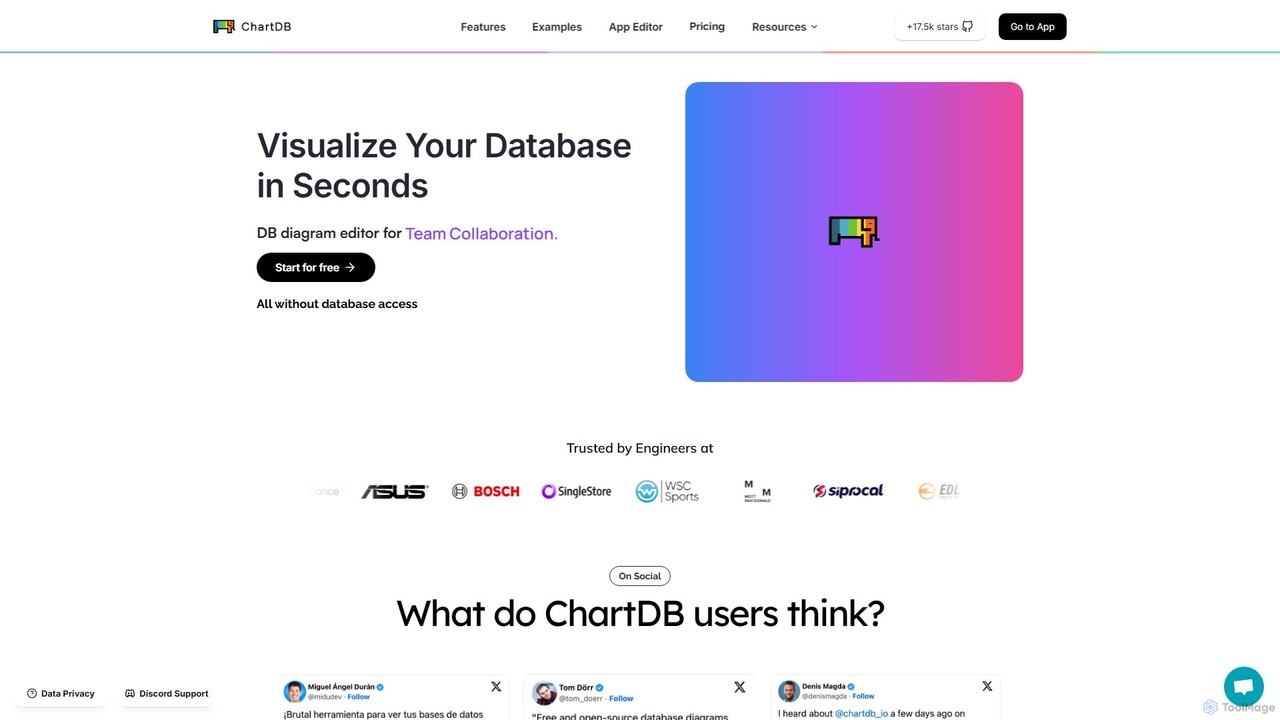
ChartDB is an AI-powered database schema visualizer that instantly generates interactive ER diagrams from a single query. It's …
ChartDB is an AI-powered database schema visualizer that instantly generates interactive ER diagrams from a single query. It's designed for developers and teams to design, document, and collaborate on database structures. It features real-time collaboration, database synchronization, and an AI assistant to optimize schema design. Both cloud and self-hosted open-source versions are available.
Athena
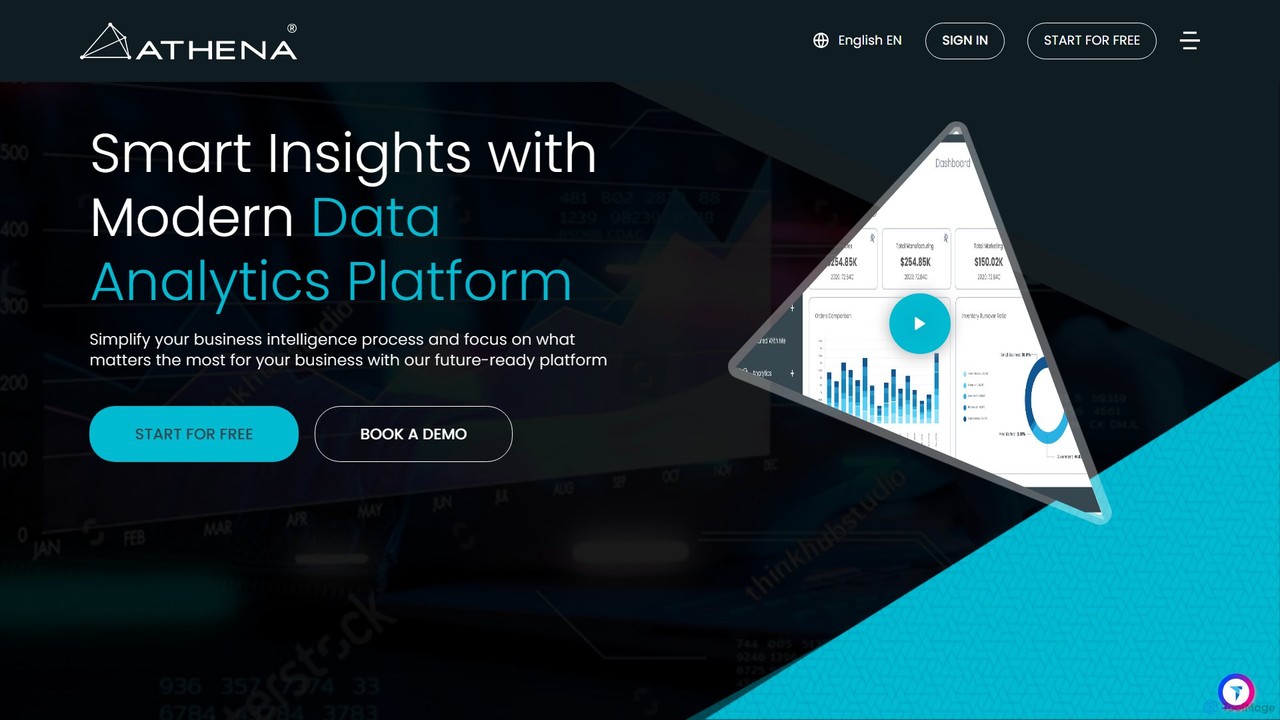
Athena is an AI-powered data analytics and business intelligence platform designed to simplify complex data. It connects to …
Athena is an AI-powered data analytics and business intelligence platform designed to simplify complex data. It connects to diverse data sources, provides advanced visualization tools, and delivers real-time, actionable insights through intuitive dashboards and automated reports, empowering businesses of all sizes to make smarter, data-driven decisions.
Bonsai
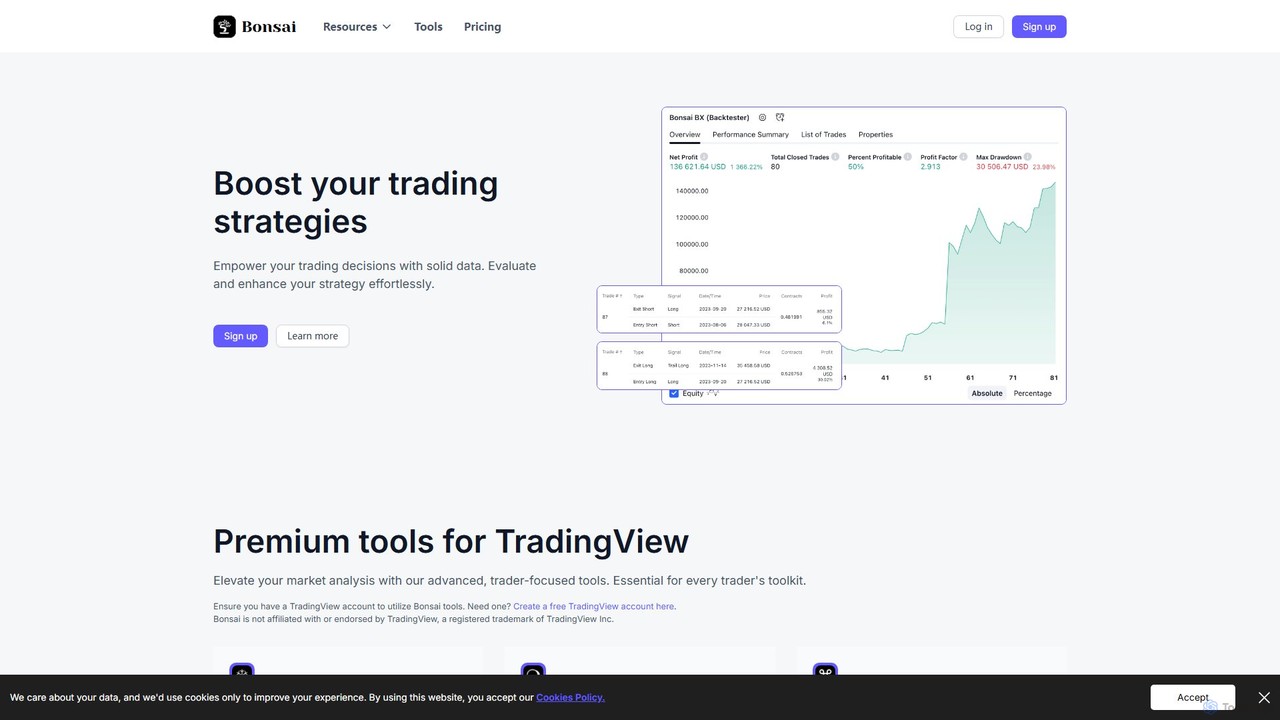
Bonsai offers a suite of premium technical analysis tools for TradingView, designed to help traders cultivate winning strategies. …
Bonsai offers a suite of premium technical analysis tools for TradingView, designed to help traders cultivate winning strategies. It features advanced indicators, oscillators, and a backtester to identify market trends, detect divergences, and validate custom strategies with precision. With intuitive alerts and a focus on non-repainting scripts, Bonsai enhances market analysis and empowers data-driven trading decisions directly within the TradingView environment.
Dataslide.ai
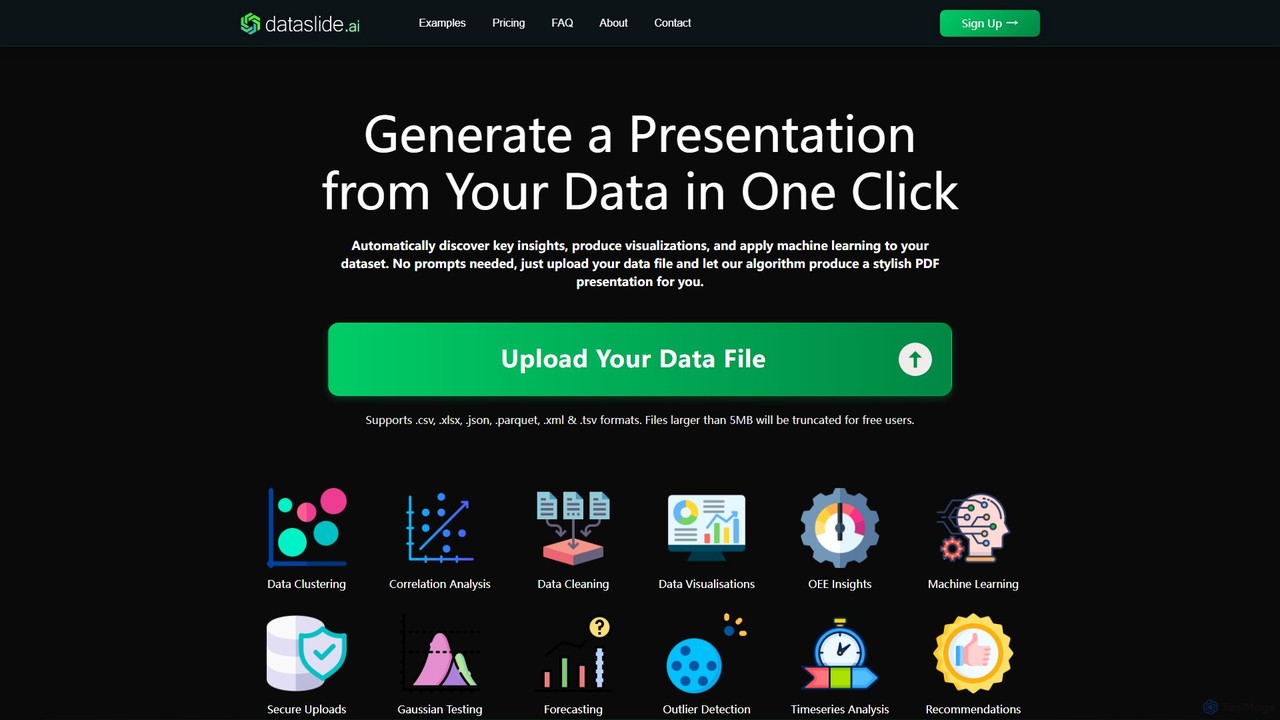
Dataslide.ai is an AI-powered tool that automatically generates insightful presentations from your data in a single click. Simply …
Dataslide.ai is an AI-powered tool that automatically generates insightful presentations from your data in a single click. Simply upload your data file (.csv, .xlsx, etc.), and it performs data cleaning, visualization, and machine learning to produce a comprehensive PDF or PowerPoint report, saving hours of manual analysis.
QueryLab
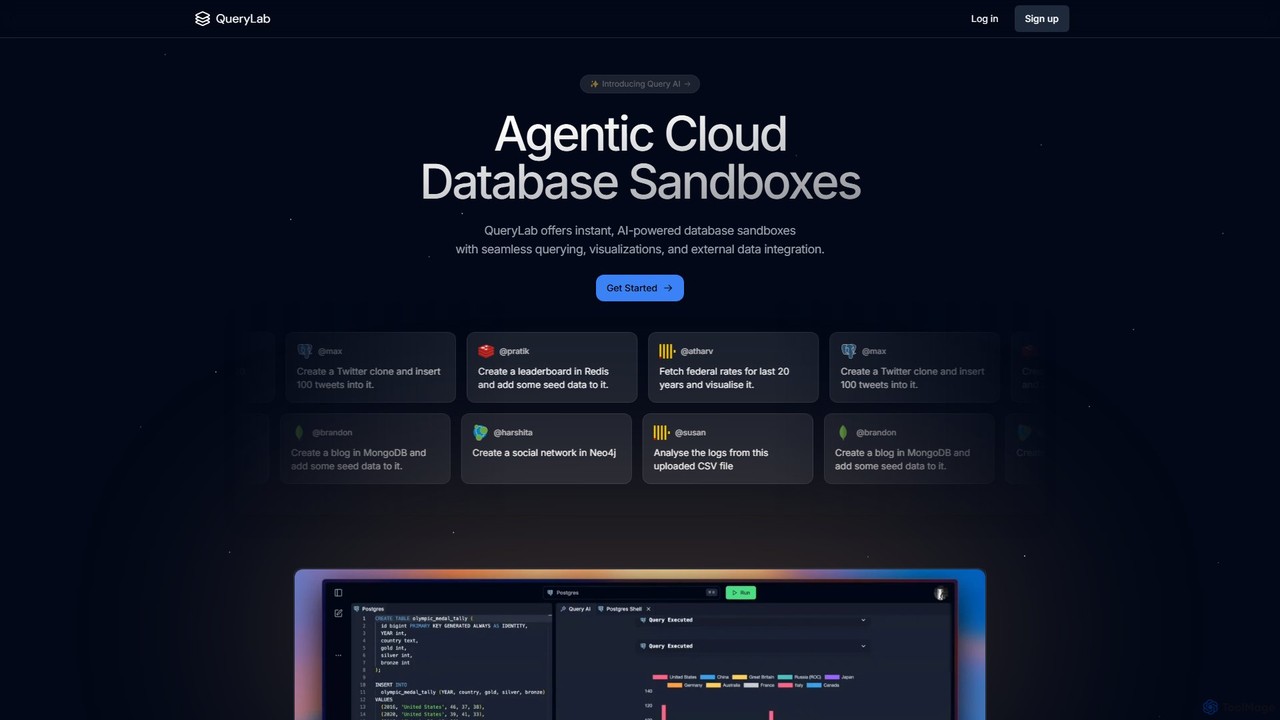
QueryLab is an AI-powered platform that provides instant database sandboxes. It allows users to interact with databases like …
QueryLab is an AI-powered platform that provides instant database sandboxes. It allows users to interact with databases like PostgreSQL, MongoDB, and Redis using natural language, seamlessly integrate external data, and automatically generate visualizations from query results.
Veezoo
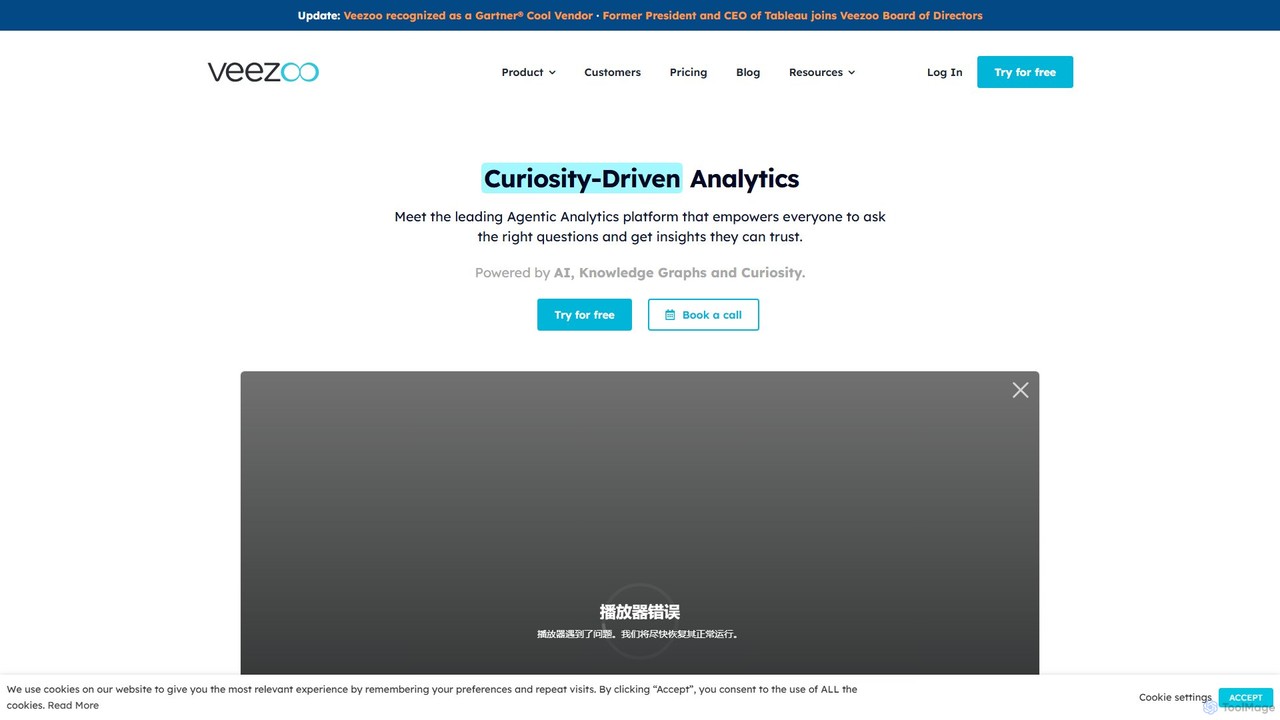
Veezoo is an AI-powered, agentic analytics platform that enables users to get trusted insights from their data by …
Veezoo is an AI-powered, agentic analytics platform that enables users to get trusted insights from their data by asking questions in natural language. It combines a ChatGPT-like interface with a robust semantic layer (Knowledge Graph) to ensure data governance, accuracy, and consistency, democratizing data analytics for everyone in an organization.

olintek
olintek is an AI-powered software platform specializing in air cargo logistics. It provides intelligent decision-making tools for aircraft …
olintek is an AI-powered software platform specializing in air cargo logistics. It provides intelligent decision-making tools for aircraft cargo load planning and ULD (Unit Load Device) build-up, designed to optimize space utilization, enhance operational efficiency, and maximize revenue for airlines, GHAs, and freight forwarders.
ChartAI
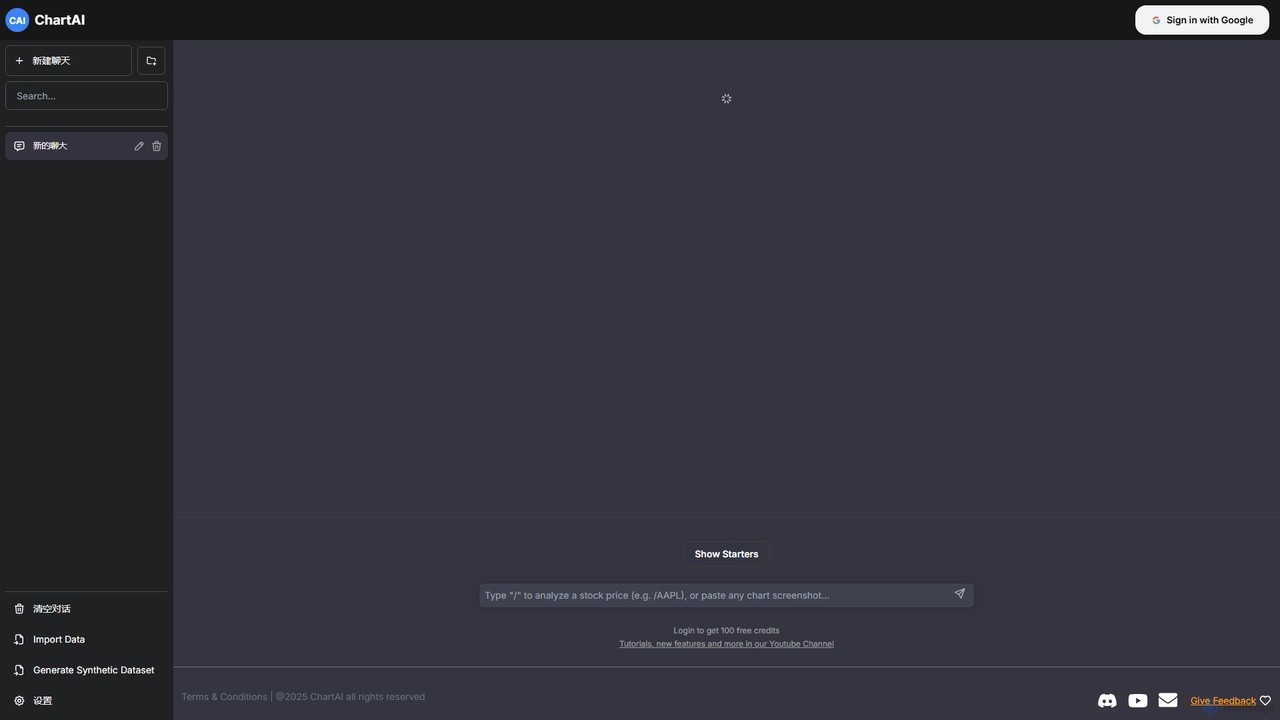
ChartAI is an AI-powered data visualization tool that transforms natural language prompts into stunning charts and graphs. Import …
ChartAI is an AI-powered data visualization tool that transforms natural language prompts into stunning charts and graphs. Import your own data or generate synthetic datasets, then simply chat with the AI to analyze information and create visualizations instantly. Ideal for analysts, researchers, and anyone needing to quickly understand and present data without writing code.
Tableau
Tableau is a leading AI-powered business intelligence and analytics platform that helps people see and understand data. It …
Tableau is a leading AI-powered business intelligence and analytics platform that helps people see and understand data. It enables users to create interactive dashboards, perform complex data analysis, and share insights across their organization, enhanced by AI features like Tableau Agent for accelerated decision-making.
Vizzy
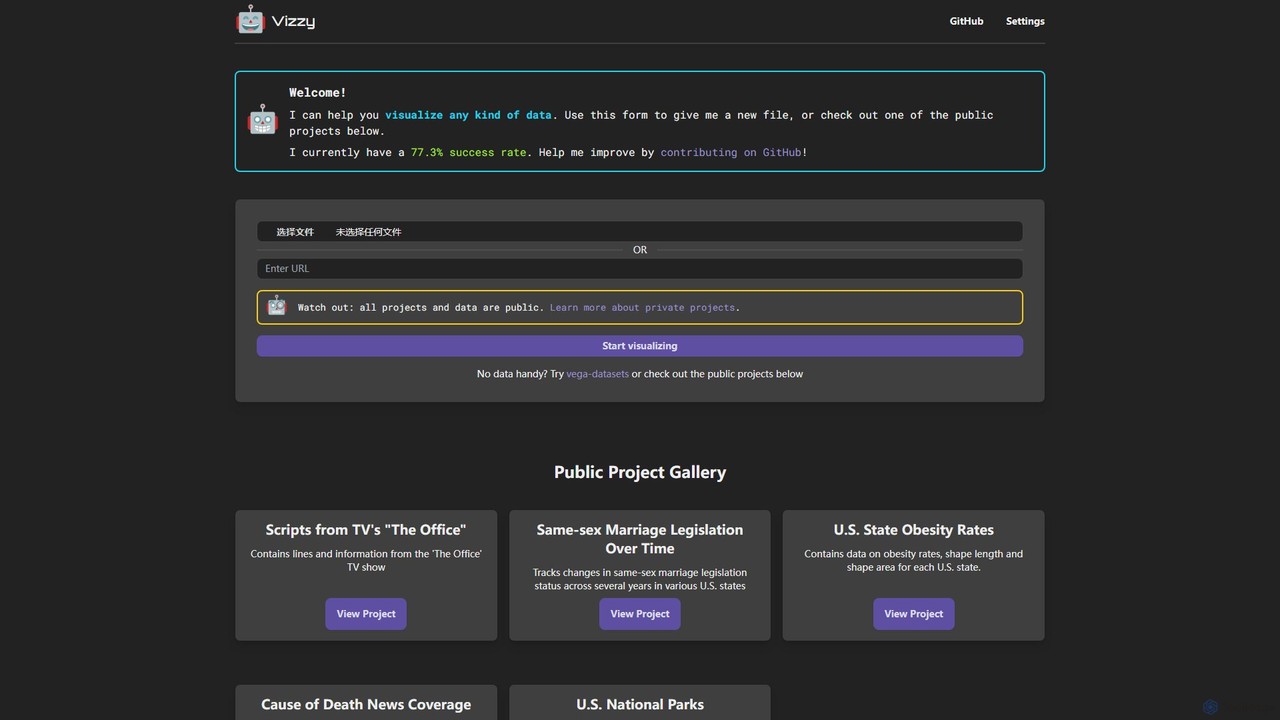
Vizzy is an AI-powered tool that leverages Large Language Models (LLMs) for rapid data visualization. Simply upload your …
Vizzy is an AI-powered tool that leverages Large Language Models (LLMs) for rapid data visualization. Simply upload your data file, and Vizzy's AI will analyze it to automatically generate insightful charts, graphs, and maps. It's a no-code, open-source platform designed to make data analysis accessible to everyone, from researchers to business analysts. Explore public datasets or visualize your own, turning raw numbers into clear visuals in seconds.
Eloquence
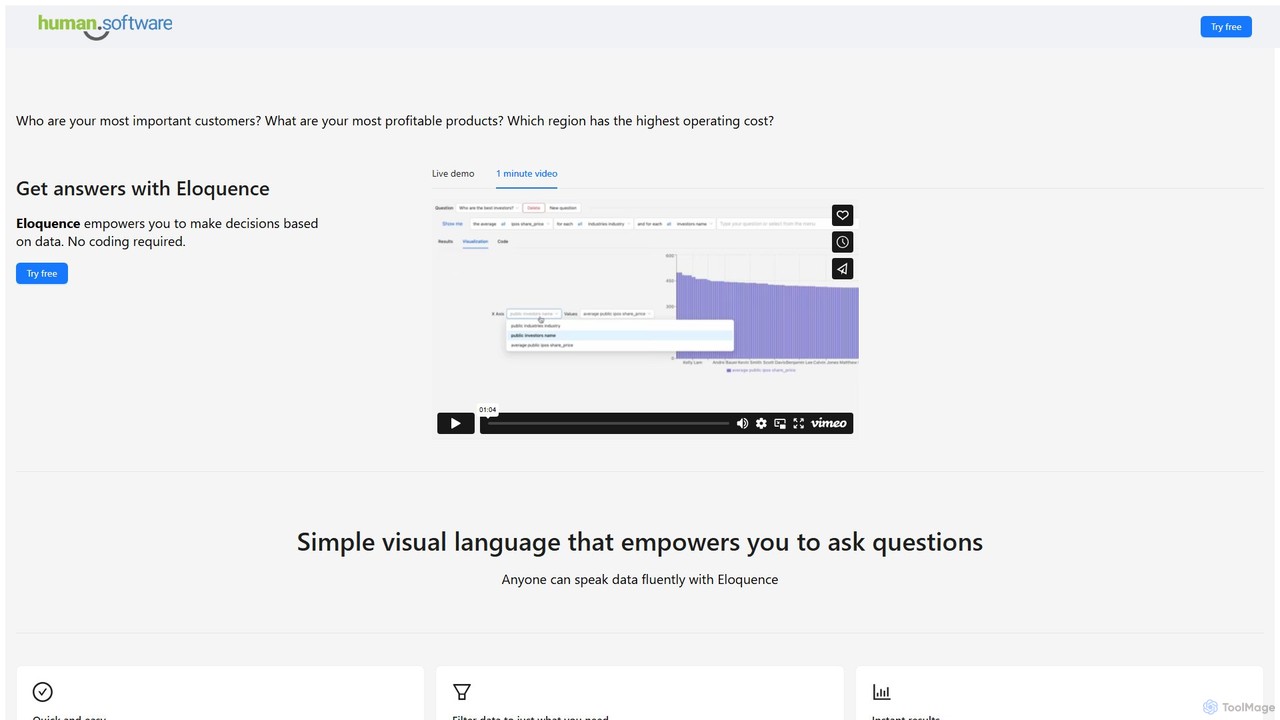
Eloquence is a no-code business intelligence platform that empowers anyone to query databases using structured natural language. Connect …
Eloquence is a no-code business intelligence platform that empowers anyone to query databases using structured natural language. Connect your data, ask complex questions without writing code, and get instant answers to make data-driven decisions. It prioritizes security with robust encryption and a strict no-data-saved policy.
Open Knowledge Maps
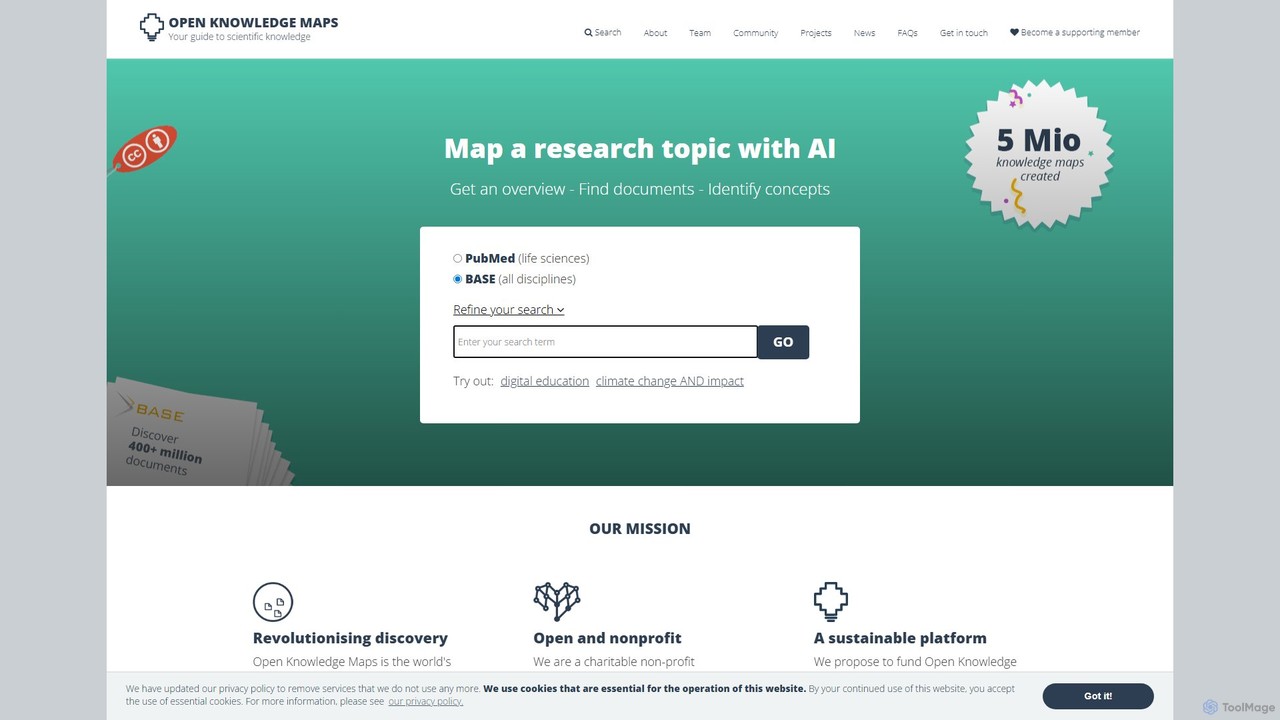
Open Knowledge Maps is a non-profit AI-powered discovery platform that transforms research discovery. It creates visual knowledge maps …
Open Knowledge Maps is a non-profit AI-powered discovery platform that transforms research discovery. It creates visual knowledge maps from millions of research articles, providing an instant overview of a topic. Instead of linear search results, it clusters documents by topic, helping users quickly identify relevant concepts and papers, especially in interdisciplinary fields. It emphasizes open access content and offers services for individuals, libraries, and institutions to enhance research visibility and assessment.

Weights & Biases
Weights & Biases is the leading MLOps platform for developers to build better models faster. It helps machine …
Weights & Biases is the leading MLOps platform for developers to build better models faster. It helps machine learning teams track experiments, version datasets, manage model lifecycles, and collaborate seamlessly. Ideal for everything from academic research to enterprise-level AI development.
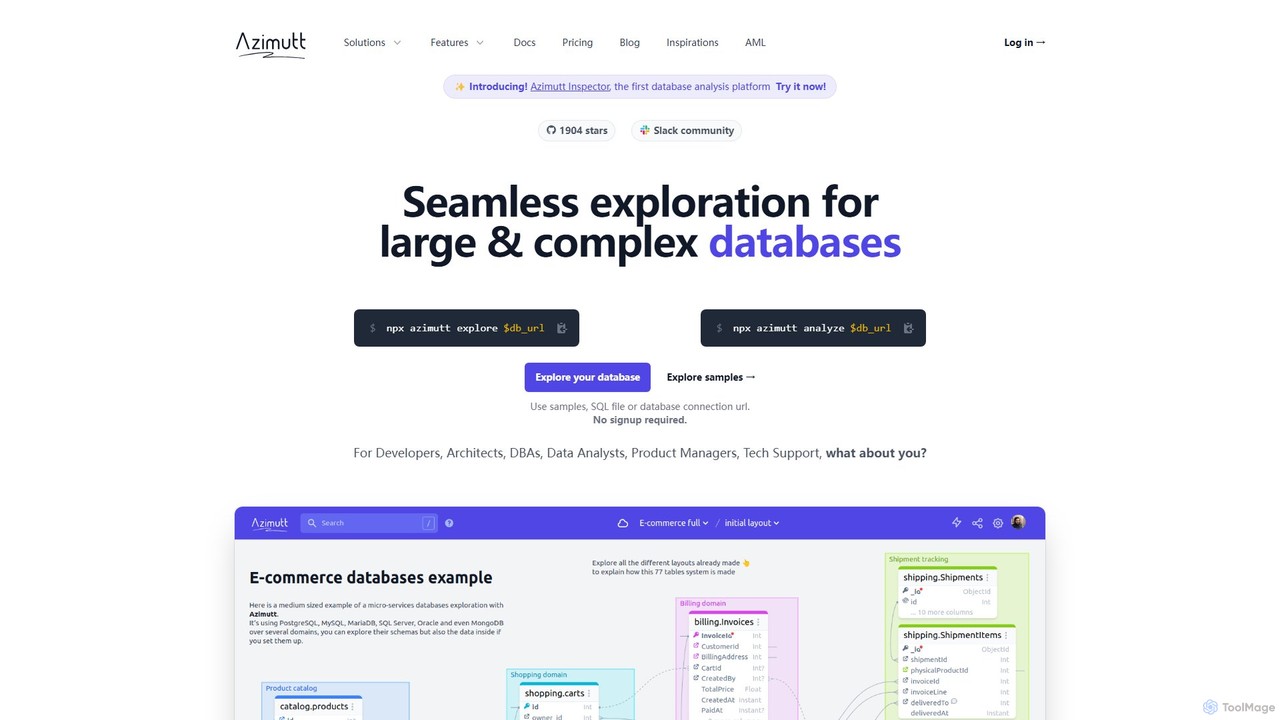
Azimutt
Azimutt is an advanced database explorer and analyzer designed for large, complex databases. It helps developers, DBAs, and …
Azimutt is an advanced database explorer and analyzer designed for large, complex databases. It helps developers, DBAs, and data analysts visualize, document, and optimize their database schemas. With features like incremental layout building, AI-powered SQL generation, and collaborative documentation, Azimutt simplifies database exploration, improves team efficiency, and ensures database health.
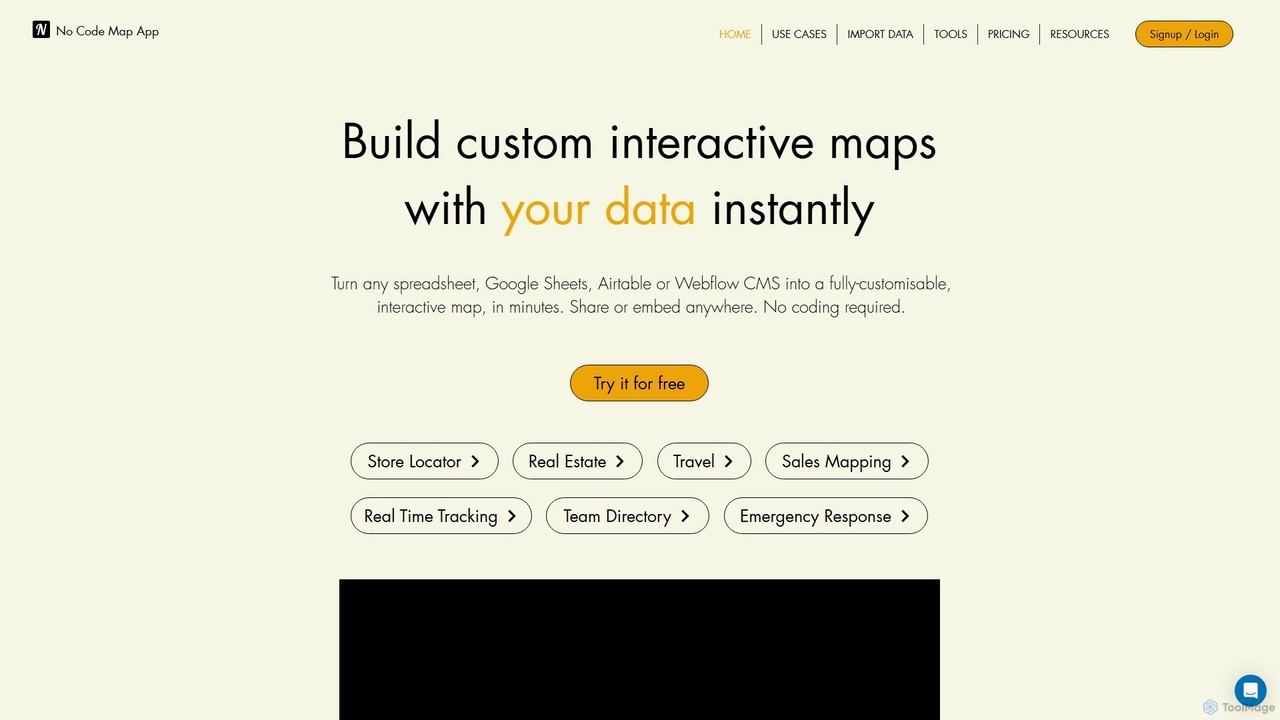
nocodemapapp
nocodemapapp is an AI-powered, no-code platform that instantly transforms data from spreadsheets, Google Sheets, Airtable, or Webflow CMS …
nocodemapapp is an AI-powered, no-code platform that instantly transforms data from spreadsheets, Google Sheets, Airtable, or Webflow CMS into fully customizable, interactive maps. Create store locators, real estate listings, or sales territory maps in minutes. Features include automatic data sync, heatmap layers, and deep design customization. Share or embed your responsive map anywhere, no coding required.

EzInsights
EzInsights is an AI-powered business intelligence platform that enables users to interact with their data using natural language. …
EzInsights is an AI-powered business intelligence platform that enables users to interact with their data using natural language. It combines generative AI with advanced analytics and visualization tools to provide instant, data-driven insights, automated reports, and predictive analytics, empowering teams to make smarter decisions without technical expertise.
SheetBot
SheetBot is an AI-powered data analysis platform that enables users to analyze, visualize, and transform data without writing …
SheetBot is an AI-powered data analysis platform that enables users to analyze, visualize, and transform data without writing any code. Simply upload your dataset or connect a data source, ask questions in plain English, and receive instant insights, trends, and dynamic visualizations. Powered by advanced models like GPT-4o and Claude 3.5 Sonnet, it streamlines complex analyses, turning hours of work into minutes.
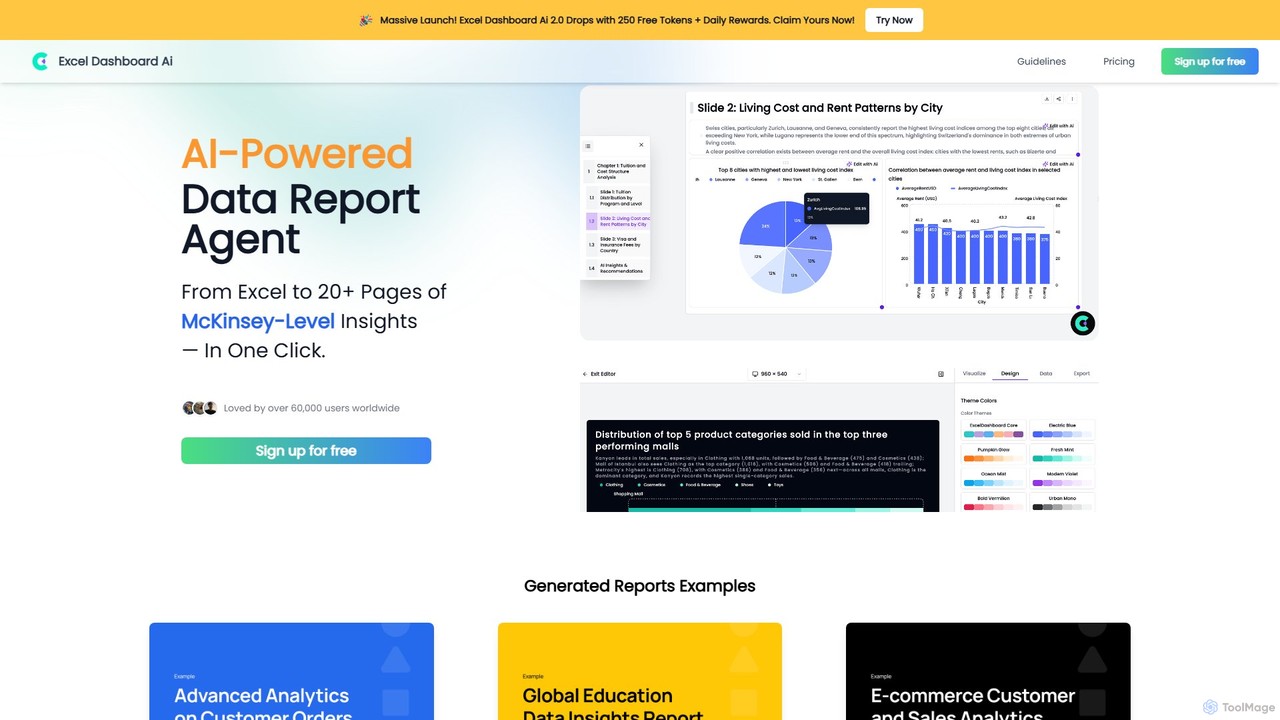
ExcelDashboard.ai
ExcelDashboard.ai is an AI-powered data analysis tool that instantly transforms raw Excel or CSV files into interactive dashboards …
ExcelDashboard.ai is an AI-powered data analysis tool that instantly transforms raw Excel or CSV files into interactive dashboards and comprehensive, multi-page reports. With a single click, it generates deep, McKinsey-level insights, visualizes data, and allows users to explore information using natural language commands. It's designed for users of all skill levels to make data-driven decisions without needing programming expertise.
aiflowchart
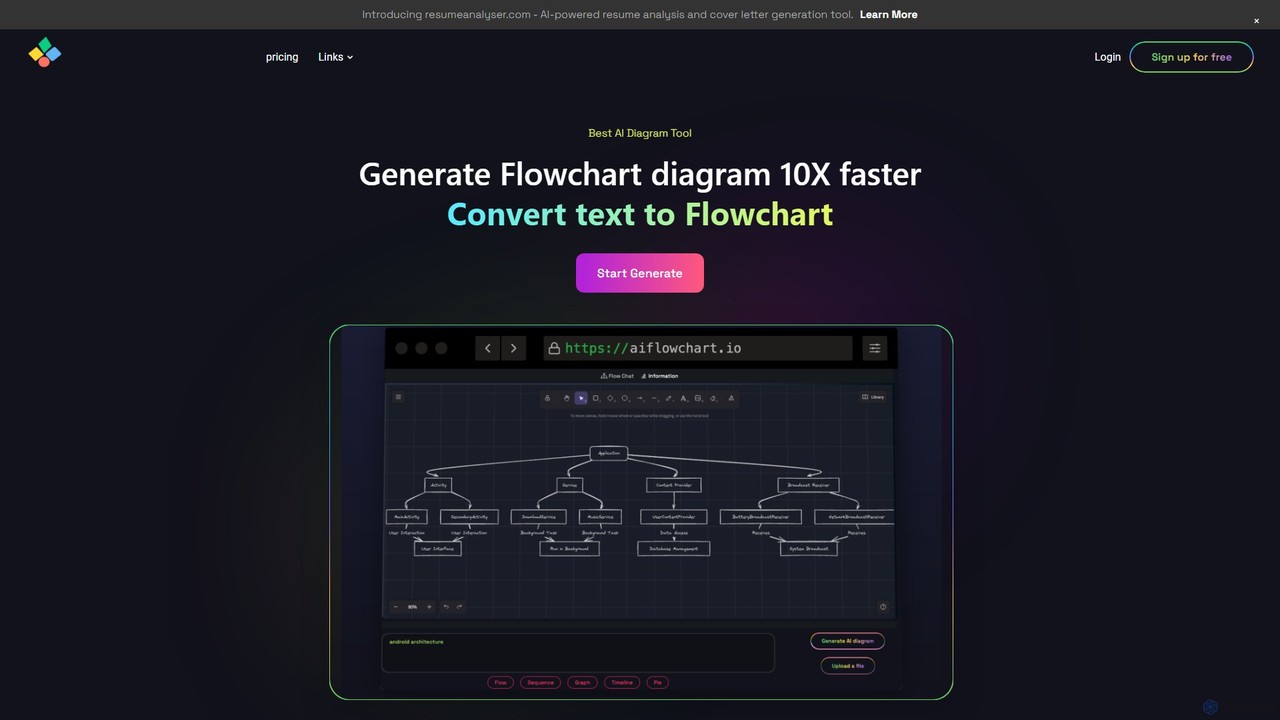
An AI-powered diagramming tool that automatically generates flowcharts, sequence diagrams, pie charts, and more from text, PDFs, or …
An AI-powered diagramming tool that automatically generates flowcharts, sequence diagrams, pie charts, and more from text, PDFs, or blog content. It leverages models like GPT-4o to create unique, customizable diagrams with explanations, saving users significant time and effort.
Docugram
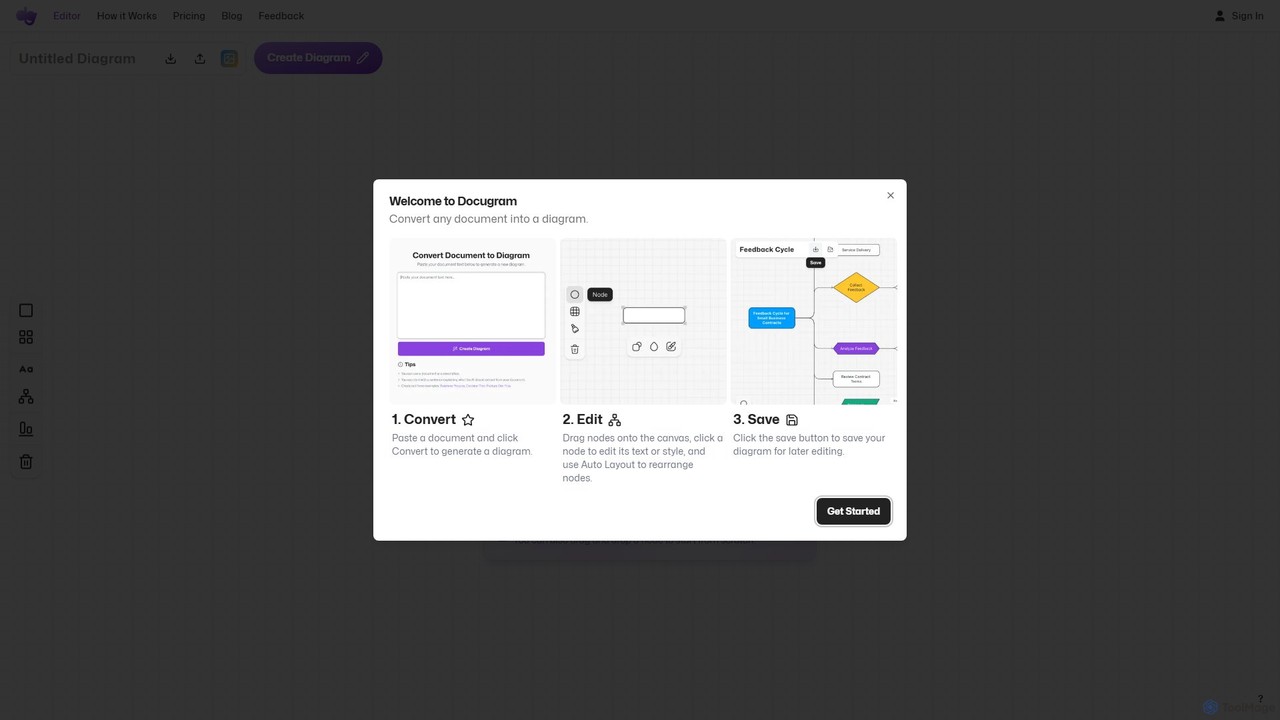
Docugram is an AI-powered tool that instantly transforms text documents, notes, and prompts into clear, editable diagrams and …
Docugram is an AI-powered tool that instantly transforms text documents, notes, and prompts into clear, editable diagrams and flowcharts. It streamlines workflows by converting complex information from formats like Word, Excel, and PDF into visual maps, enhancing productivity for professionals in project management, development, and business analysis.
About Visualization
AI Visualization tools are a sophisticated category of AI-powered solutions specifically designed to transform complex, raw data into intuitive, interactive, and actionable visual representations. These advanced tools leverage cutting-edge artificial intelligence algorithms, including machine learning, deep learning, and natural language processing, to automate the entire data interpretation process. They intelligently suggest optimal chart types based on data characteristics, identify hidden patterns and anomalies, and even generate dynamic, customizable dashboards. The primary value of AI Visualization lies in its ability to empower users to quickly identify critical insights, understand underlying trends, and make more informed, data-driven decisions from vast and disparate datasets, significantly enhancing the efficiency and depth of data analysis.
Core Features
- Intelligent Chart Recommendation: AI algorithms analyze the structure and nature of your data to automatically suggest the most appropriate and effective visualization types, from bar charts to complex network graphs.
- Automated Data Insights: Beyond mere display, these tools proactively identify key trends, outliers, correlations, and anomalies within datasets, often providing natural language explanations for these discoveries.
- Natural Language Report Generation: Many advanced AI visualization platforms can translate complex visual findings into clear, concise, and easy-to-understand textual summaries and comprehensive reports.
- Interactive Dashboard Building: Users can rapidly create dynamic, customizable dashboards with drill-down capabilities, filters, and real-time updates, allowing for deep exploration of data.
- Real-time Data Integration: Seamlessly connects with a wide array of data sources, including databases, cloud platforms, APIs, and various file formats, ensuring visualizations are always based on the most current information.
Applicable Scenarios
AI Visualization tools are becoming indispensable across a multitude of professional domains. Business intelligence analysts utilize them to gain deep insights into market trends, sales performance, and customer behavior, transforming raw numbers into strategic advantages. Researchers in scientific and academic fields leverage these tools to explore and present complex experimental data, simulations, and statistical models in an intuitive manner. Marketing and communications professionals employ AI visualization to craft compelling data stories, illustrating campaign effectiveness, audience engagement, and brand sentiment. Furthermore, financial analysts use them to identify risk patterns and investment opportunities, while healthcare providers visualize patient data for improved diagnostics and treatment planning.
How to Choose
Selecting the ideal AI Visualization tool requires a careful evaluation of several critical factors to ensure it aligns with your specific needs. Firstly, assess its compatibility with your existing data infrastructure, including support for various databases, cloud services, and file formats. Secondly, examine the breadth and depth of visualization types offered, along with the flexibility for customization to meet unique reporting requirements. Thirdly, evaluate the sophistication of its AI capabilities, such as the accuracy of automated insights, chart recommendations, and natural language generation. User interface intuitiveness, ease of use, and the learning curve are also paramount for widespread adoption. Finally, consider collaboration features, sharing options, security protocols, and the pricing model to ensure it scales with your team and budget.
Featured Tool Leaderboard
Most Popular
Sorted by highest monthly traffic
Most Interactive
Sorted by lowest bounce rate
Highest User Engagement
Sorted by Average Visit Duration
Top Free Tools
Free and sorted by traffic
VisualizationUse Cases
Marketing Campaign Performance Analysis
Marketing professionals utilize AI visualization tools to consolidate data from various advertising platforms, website analytics, and CRM systems. The tools automatically generate interactive dashboards, allowing marketers to quickly identify top-performing channels, content, and audience segments. This enables data-driven optimization of campaign strategies, budget allocation, and ROI measurement, saving significant time compared to manual reporting.
Sales Performance & Forecasting
Sales managers leverage AI visualization to gain comprehensive insights into historical sales data, customer demographics, and market trends. These tools present complex sales funnels, regional performance, and individual rep productivity through intuitive charts and predictive models. This helps in identifying growth opportunities, forecasting future sales revenue, and making strategic decisions for sales team management and resource allocation.
Financial Risk & Fraud Detection
Financial analysts and risk managers employ AI visualization to process vast amounts of transactional data, market fluctuations, and compliance records. The tools automatically highlight anomalies, potential fraud patterns, and emerging risk factors through heatmaps, scatter plots, and network graphs. This provides a clear, real-time overview of financial health and potential vulnerabilities, aiding in proactive risk mitigation and regulatory adherence.
Healthcare Patient Data Insights
Healthcare administrators and medical researchers use AI visualization to analyze patient records, treatment outcomes, drug efficacy, and epidemiological data. The tools transform complex clinical data into accessible dashboards, revealing patterns in disease progression, treatment effectiveness, and population health trends. This supports evidence-based clinical decision-making, resource allocation, and the identification of areas for public health intervention.
Supply Chain Optimization
Supply chain managers utilize AI visualization to monitor and optimize complex logistics, inventory levels, and supplier performance. By integrating data from various points in the supply chain, these tools provide dynamic dashboards that pinpoint bottlenecks, predict demand fluctuations, and visualize delivery routes. This leads to improved inventory management, reduced operational costs, and enhanced overall supply chain resilience and efficiency.
Social Media Sentiment Analysis
Brand managers and PR teams deploy AI visualization tools to analyze large volumes of social media data, including comments, mentions, and engagement metrics. The tools generate sentiment trend graphs, keyword clouds, and demographic breakdowns, offering immediate insights into public perception and brand reputation. This enables rapid response to crises, identification of influencer opportunities, and refinement of communication strategies.