ToolMage
Sign in

Best 32 Diagramming AI tools for Productivity

Popular Diagramming AI tools in Productivity include Lucidchart, Creately, GitMind, EdrawMax, Edraw.AI, Cloudairy, ChartDB, ConceptMap AI, Diagramming AI, and ChatUML, helping you work more efficiently.

EdrawMax
Freemium

EdrawMax

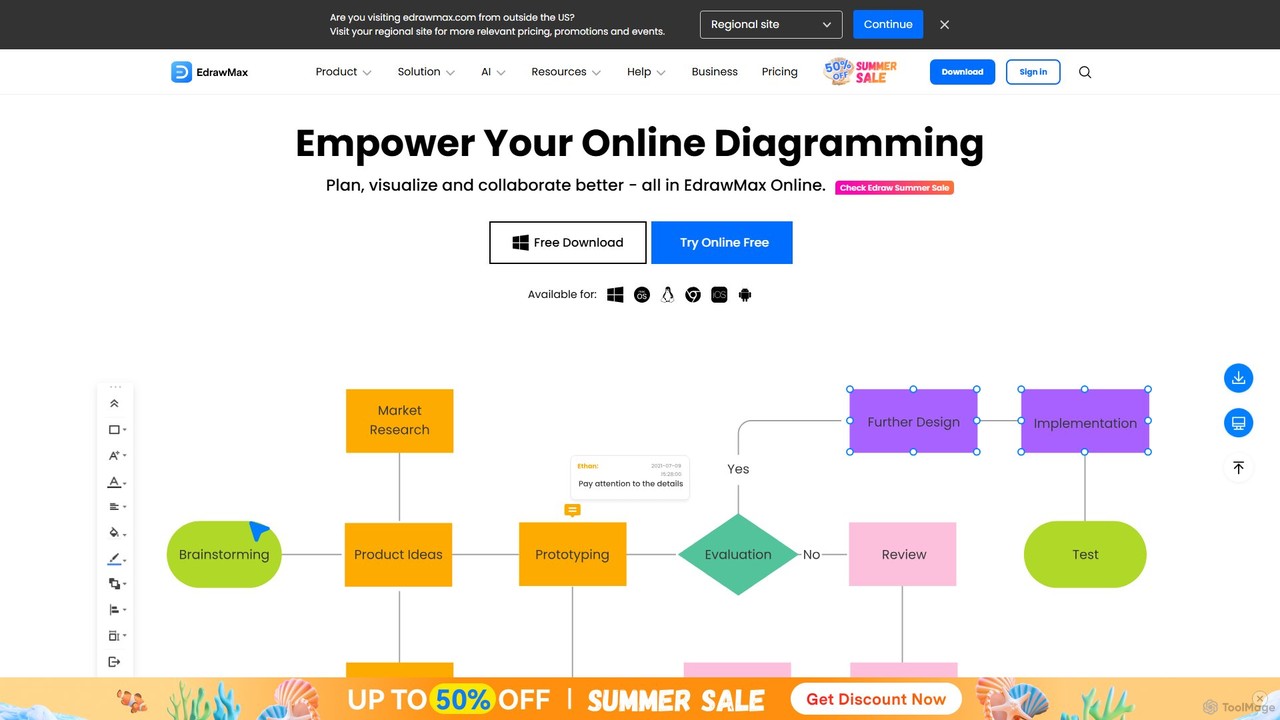
EdrawMax is an all-in-one, AI-powered diagramming tool for creating over 210 types of diagrams, from flowcharts to floor plans. It combines intuitive drag-and-drop functionality with advanced AI features like one-click diagram generation, content analysis, and OCR. Ideal for teams and individuals, it facilitates real-time collaboration, offers extensive templates, and serves as a powerful Visio alternative for visualizing ideas and workflows.

Project Management
Visits 533.2KFavorites 154Likes 138
Flowchartmaker
Freemium

Flowchartmaker

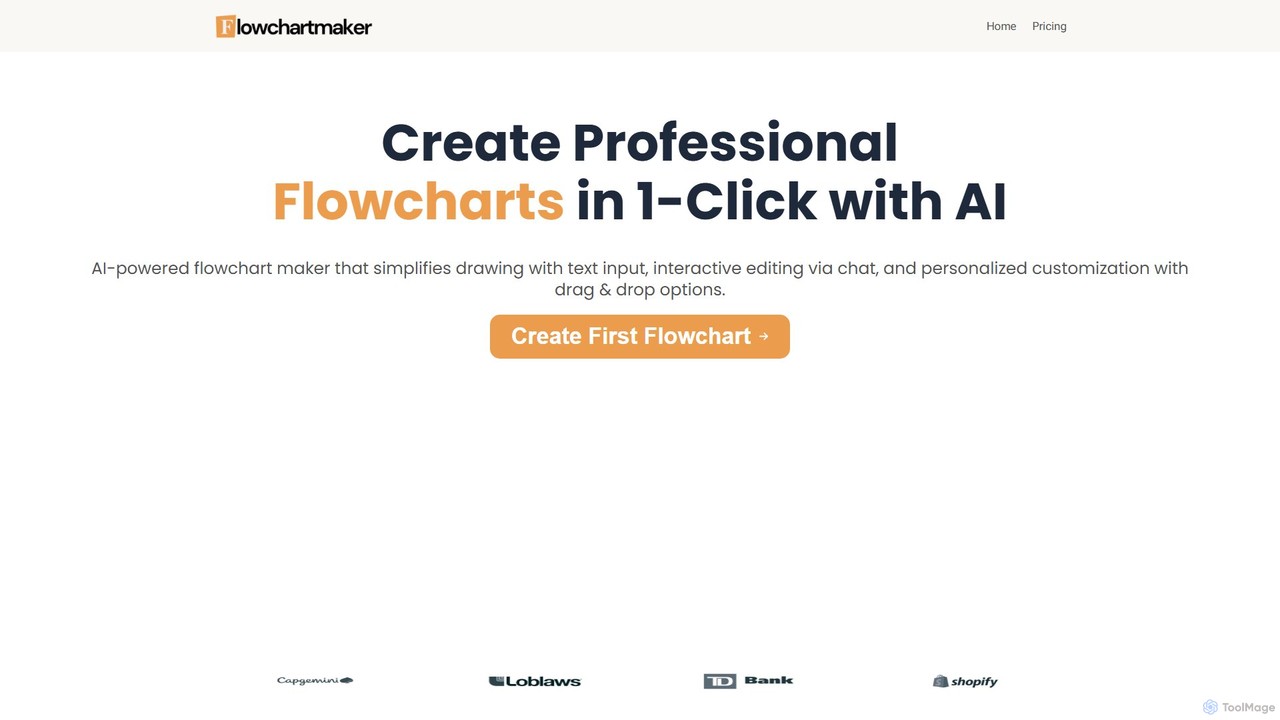
An AI-powered tool that instantly creates professional flowcharts from simple text descriptions. It features interactive editing via a chat interface and full customization with drag-and-drop options, streamlining the process of visualizing workflows and ideas.

Process Management
Visits 5.9KFavorites 132Likes 147
Dezyn
Freemium

Dezyn

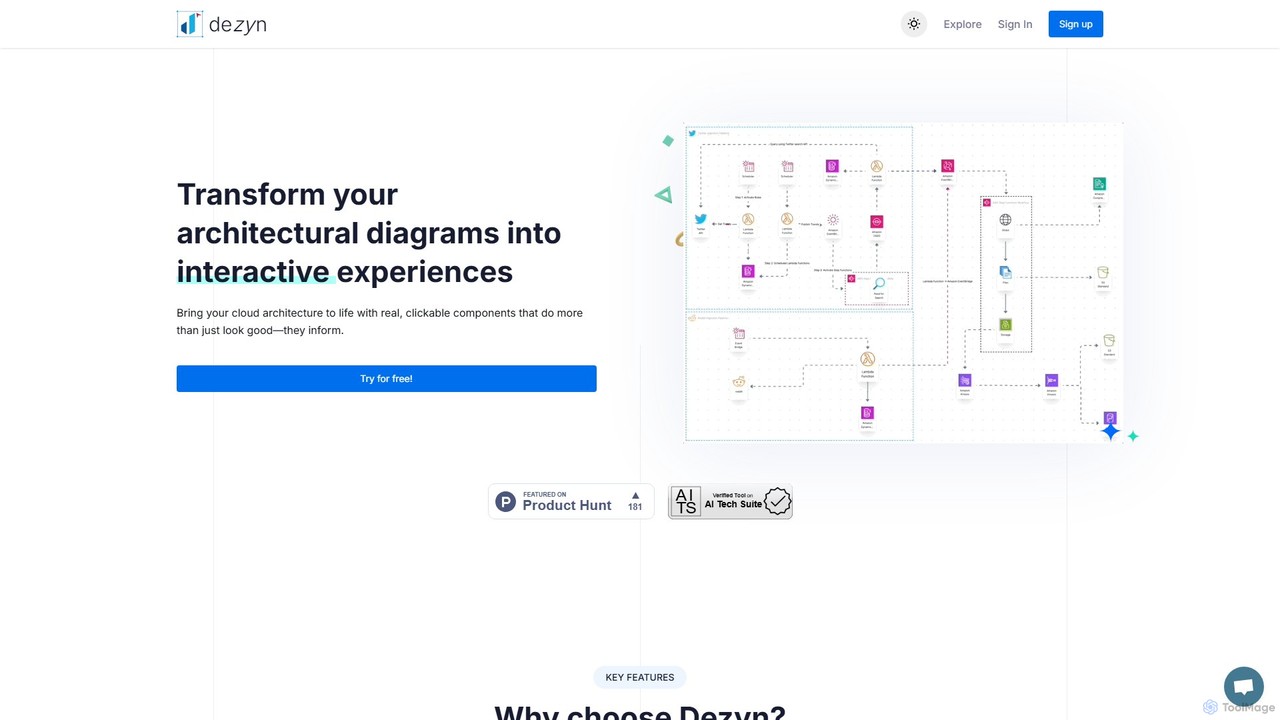
Dezyn is an AI-powered platform for creating interactive, data-rich architectural diagrams and flowcharts. It transforms text prompts, hand-drawn sketches, or wireframes into professional diagrams. Ideal for engineers, developers, and tech creators to visualize complex cloud systems (AWS, Azure, GCP) and collaborate effectively.

Flowchart
Visits 6.6KFavorites 118Likes 121
Mermaid Chart
Freemium

Mermaid Chart

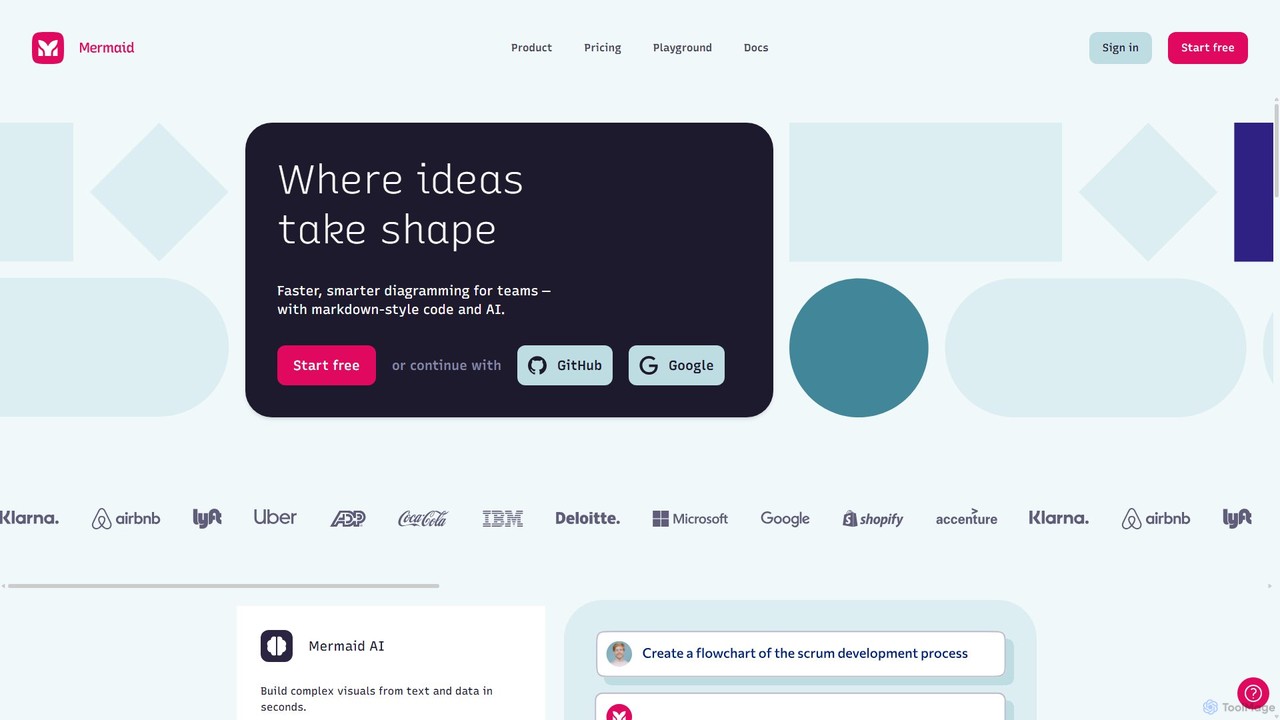
Mermaid Chart is an AI-powered diagramming tool that enables teams to create complex visuals like flowcharts, sequence diagrams, and mind maps using markdown-style code, natural language prompts, or a visual editor. It's designed for faster, smarter diagramming and seamless collaboration.

Code Generation
Visits 7.7KFavorites 148Likes 139
aiflowchart
Freemium

aiflowchart

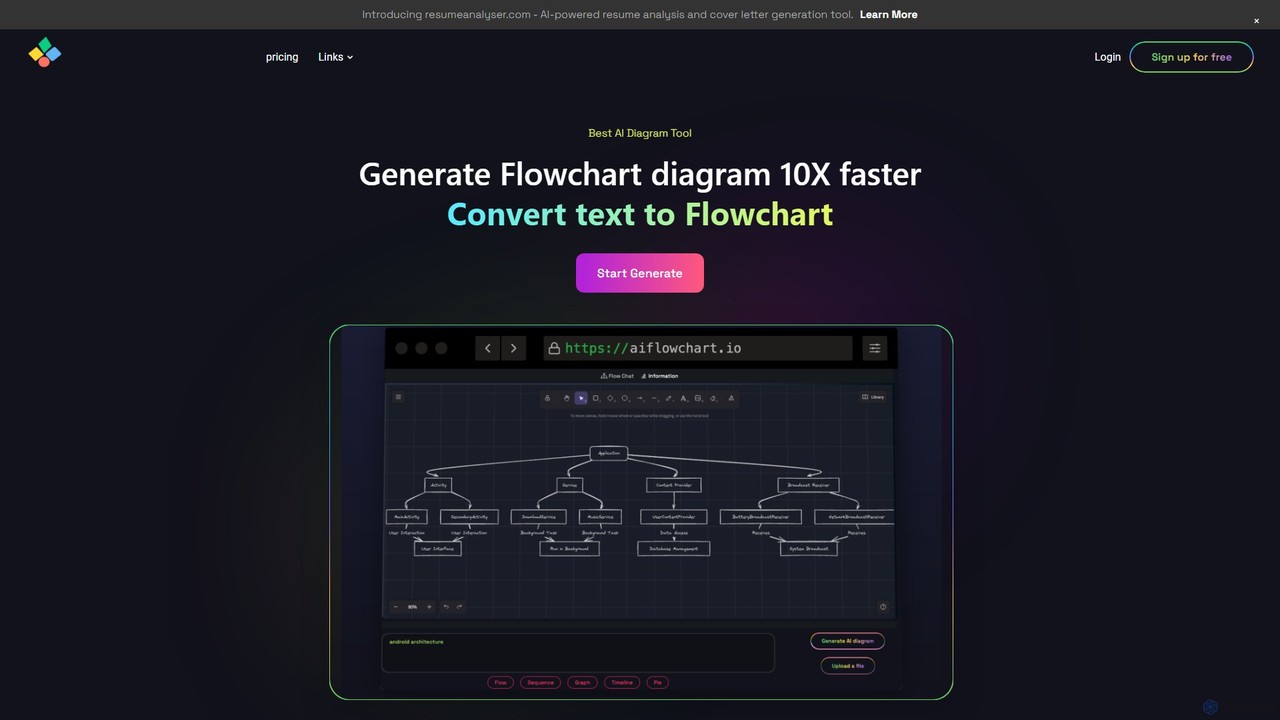
An AI-powered diagramming tool that automatically generates flowcharts, sequence diagrams, pie charts, and more from text, PDFs, or blog content. It leverages models like GPT-4o to create unique, customizable diagrams with explanations, saving users significant time and effort.

Visualization
Visits 7.2KFavorites 109Likes 97
Docugram
Freemium

Docugram

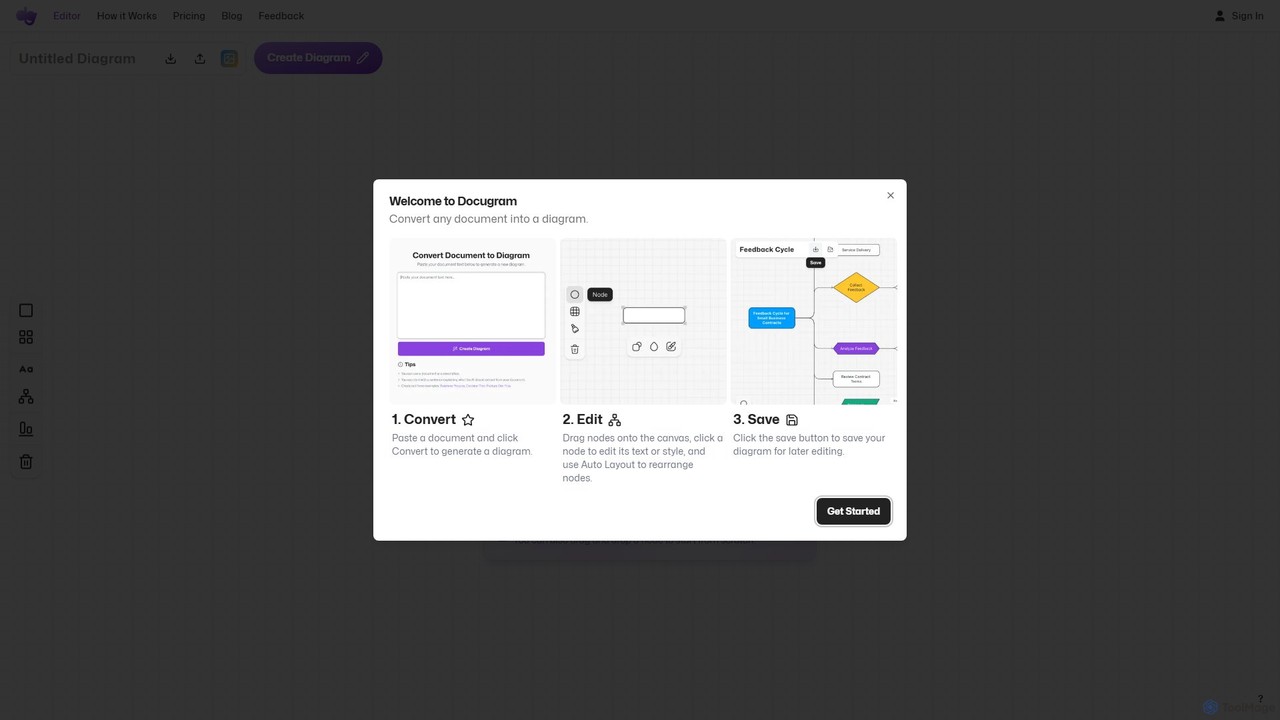
Docugram is an AI-powered tool that instantly transforms text documents, notes, and prompts into clear, editable diagrams and flowcharts. It streamlines workflows by converting complex information from formats like Word, Excel, and PDF into visual maps, enhancing productivity for professionals in project management, development, and business analysis.

Project Management
Visits 8.9KFavorites 129Likes 127
Text to Flowchart
Freemium

Text to Flowchart

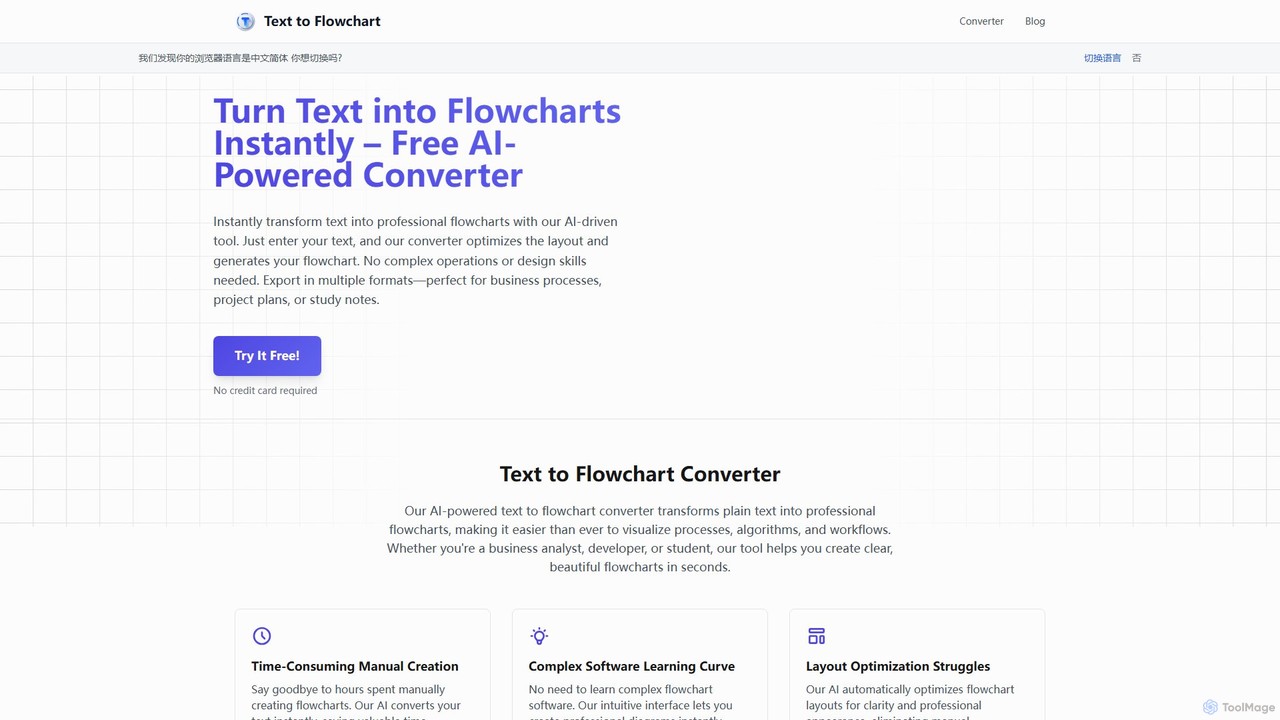
An AI-powered tool that instantly transforms plain text descriptions into professional, well-structured flowcharts and diagrams. Ideal for developers, business analysts, and students, it simplifies the visualization of processes, algorithms, and workflows without requiring design skills.

Process Management
Visits 6KFavorites 148Likes 122
draft1.ai
Freemium

draft1.ai

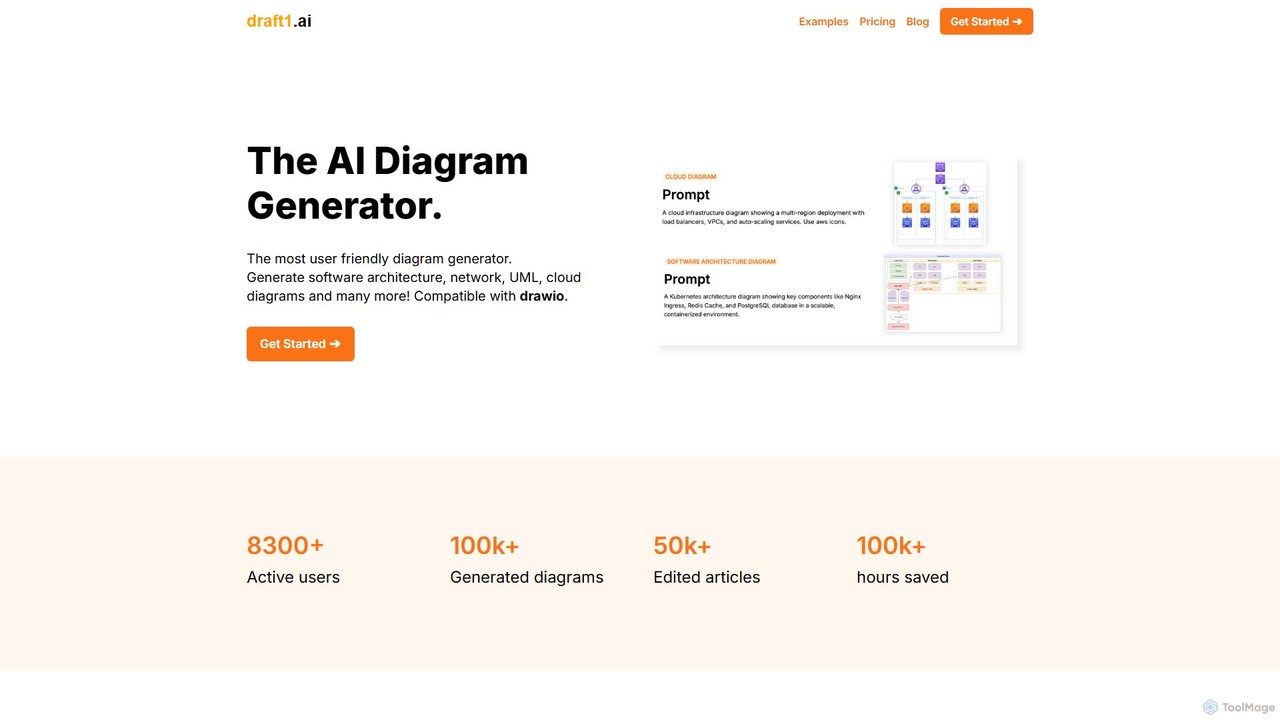
draft1.ai is an AI-powered diagram generator that transforms your text, notes, and ideas into professional diagrams like ER, UML, Kubernetes, and network layouts. Simply paste your text to instantly create visual illustrations and a first-draft report. Edit diagrams as needed and export your work in multiple formats, streamlining your documentation and design process.

Software Development
Visits 14.5KFavorites 117Likes 107

About Diagramming

AI Diagramming tools automate and enhance the creation of visual representations like flowcharts, mind maps, and network diagrams. Leveraging AI, these tools streamline the process of transforming complex data or ideas into clear, structured visuals. They significantly improve visual communication, project planning, and system design by reducing manual effort and ensuring consistency. This integration of AI allows for quicker iteration and more intelligent layout suggestions.

Core Features

  • Intelligent Layout & Auto-arrangement: Automatically organizes elements and connections for optimal readability and aesthetic appeal.
  • Text-to-Diagram Generation: Converts natural language descriptions or structured text into visual diagrams instantly.
  • Smart Template & Suggestion: Offers context-aware templates and suggests relevant shapes, connections, or diagramming best practices.
  • Data-driven Diagramming: Generates diagrams directly from data sources, such as spreadsheets or databases, for dynamic visualization.
  • Collaboration & Version Control: Facilitates real-time teamwork on diagrams and tracks changes for easy review and rollback.

Use Cases

Project managers utilize these tools for creating detailed Gantt charts and workflow diagrams to track progress. Software developers employ them for generating UML diagrams and system architectures from specifications. Business analysts visualize complex processes, organizational structures, and data flows to improve operational clarity.

How to Choose

When selecting an AI Diagramming tool, consider the specific types of diagrams you need to create, the level of AI automation desired (e.g., text-to-diagram capabilities), integration with your existing productivity suite, and collaboration features for team projects. Evaluate ease of use, customization options, and the availability of industry-specific templates.

Featured tool rankings

Diagramming use cases

1

Automate Flowchart Creation from Text

A business analyst needs to document a complex new process. Instead of manually dragging and dropping shapes, they input a step-by-step textual description of the process into an AI diagramming tool. The tool automatically generates a complete, logically structured flowchart, saving hours of manual drawing and ensuring consistency across documentation.

2

Generate Mind Maps for Brainstorming Sessions

A marketing team is brainstorming ideas for a new campaign. During the meeting, a designated note-taker inputs key concepts and connections into the AI diagramming tool using natural language. The tool instantly organizes these inputs into a visually appealing and hierarchical mind map, allowing the team to visualize relationships and expand on ideas in real-time without interruption.

3

Visualize Software Architecture from Code/Specs

A software architect needs to create a detailed UML diagram or system architecture overview for a new module. By feeding existing code snippets, design specifications, or even high-level descriptions into an AI diagramming tool, it can automatically infer relationships and components, generating a preliminary diagram. This significantly accelerates the initial design phase and reduces errors.

4

Create Organizational Charts from Employee Data

An HR manager needs to update the company's organizational chart after a restructuring. Instead of manually rearranging boxes, they upload a spreadsheet containing employee names, roles, and reporting lines to an AI diagramming tool. The tool automatically processes the data and generates an accurate, hierarchical organizational chart, ensuring all reporting structures are correctly represented.

5

Design Network Topologies for IT Infrastructure

An IT administrator is planning a new network deployment and needs to visualize the proposed infrastructure. By inputting device lists, connection types, and IP ranges, the AI diagramming tool can intelligently suggest and arrange network components, creating a clear and comprehensive network topology diagram. This helps in identifying potential bottlenecks and optimizing resource allocation.

6

Develop Data Flow Diagrams for System Analysis

A system analyst is tasked with understanding how data moves through an existing enterprise system. By describing the data sources, processes, and destinations, the AI diagramming tool can assist in constructing a data flow diagram (DFD). This visual representation clarifies data transformations and storage, aiding in system optimization and identifying security vulnerabilities.

Diagramming FAQ

What are AI Diagramming tools?

AI Diagramming tools are software applications that leverage artificial intelligence to assist in the creation, organization, and visualization of various diagrams. They go beyond traditional diagramming by automating tasks like layout, suggesting elements, and even generating diagrams from text or data. Their core purpose is to simplify complex visual communication, making it faster and more accessible for users across different industries.

How do AI Diagramming tools differ from traditional diagramming software?

The primary difference lies in automation and intelligence. Traditional software requires manual placement and connection of every element. AI Diagramming tools, however, use algorithms to:

  • Automate Layout: Intelligently arrange shapes and lines for optimal clarity.
  • Generate from Input: Convert text descriptions or data into visual diagrams.
  • Suggest Elements: Proactively recommend shapes, connectors, or templates based on context.
  • Enhance Consistency: Ensure uniform styling and adherence to diagramming standards.
This significantly reduces manual effort and speeds up the diagram creation process.

What types of diagrams can AI Diagramming tools create?

AI Diagramming tools are versatile and can create a wide range of diagrams, including:

  • Flowcharts: For processes and workflows.
  • Mind Maps: For brainstorming and idea organization.
  • UML Diagrams: For software design (e.g., class, sequence, activity diagrams).
  • Network Diagrams: For IT infrastructure visualization.
  • Organizational Charts: For reporting structures.
  • Gantt Charts: For project scheduling.
Many tools also support custom diagram types and data visualization charts.

Who benefits most from using AI Diagramming tools?

Professionals across various fields benefit significantly. This includes:

  • Project Managers: For planning, tracking, and communicating project workflows.
  • Software Developers & Architects: For designing systems, documenting code, and visualizing complex architectures.
  • Business Analysts: For mapping processes, understanding data flows, and illustrating organizational structures.
  • Educators & Students: For explaining concepts and organizing research.
  • Content Creators: For visual storytelling and explaining complex topics.
Anyone needing to quickly and clearly convey information visually will find these tools invaluable.

How do AI Diagramming tools contribute to overall productivity?

AI Diagramming tools enhance productivity by drastically reducing the time and effort spent on creating and refining visual diagrams. They automate repetitive tasks like element placement and connection, minimize errors through intelligent suggestions, and enable faster iteration of designs. This allows users to focus more on the content and strategic aspects of their work, rather than the mechanics of drawing, thereby streamlining communication and decision-making processes within the broader "Productivity" category.